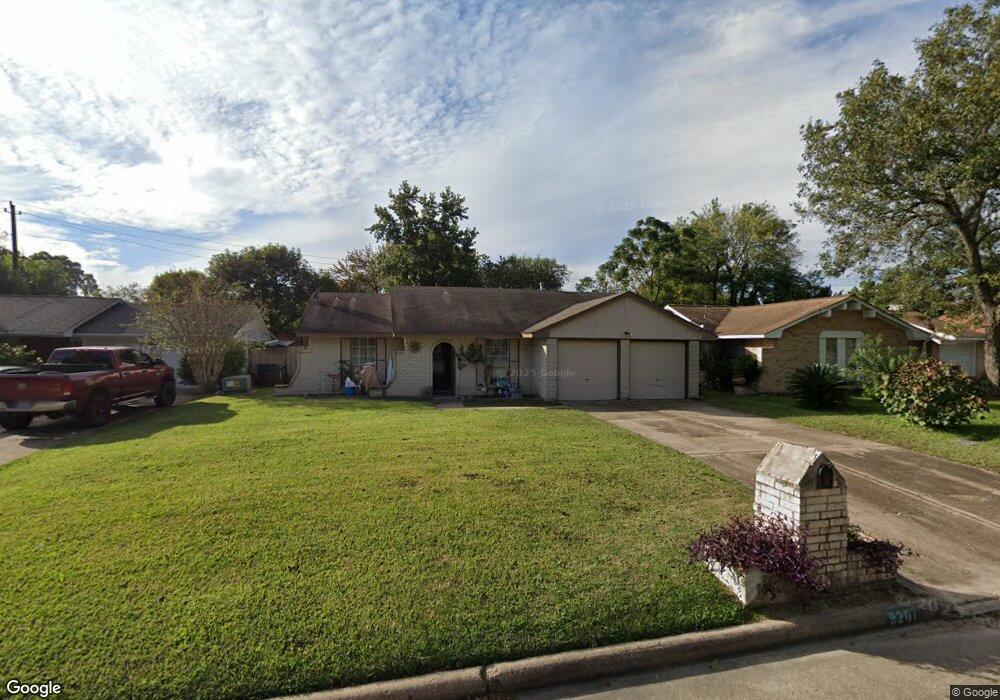
9207 Guywood St Houston, TX 77040
Greater Inwood NeighborhoodEstimated Value: $182,000 - $205,000
3
Beds
2
Baths
1,175
Sq Ft
$164/Sq Ft
Est. Value
About This Home
This home is located at 9207 Guywood St, Houston, TX 77040 and is currently estimated at $193,089, approximately $164 per square foot. 9207 Guywood St is a home located in Harris County with nearby schools including Edward a Vines EC/Pre-K/K School, Ermel Elementary School, and Dr. Viola K. Garcia Middle School.
Ownership History
Date
Name
Owned For
Owner Type
Purchase Details
Closed on
Nov 10, 2003
Sold by
Montemayor Ricardo and Montemayor Sandra
Bought by
Marbut Evony
Current Estimated Value
Home Financials for this Owner
Home Financials are based on the most recent Mortgage that was taken out on this home.
Original Mortgage
$74,593
Outstanding Balance
$34,413
Interest Rate
5.93%
Mortgage Type
Purchase Money Mortgage
Estimated Equity
$158,676
Purchase Details
Closed on
May 28, 1998
Sold by
Condrey Robert and Parks Connie
Bought by
Montemayor Ricardo and Montemayor Sandra
Home Financials for this Owner
Home Financials are based on the most recent Mortgage that was taken out on this home.
Original Mortgage
$50,511
Interest Rate
7.2%
Create a Home Valuation Report for This Property
The Home Valuation Report is an in-depth analysis detailing your home's value as well as a comparison with similar homes in the area
Home Values in the Area
Average Home Value in this Area
Purchase History
| Date | Buyer | Sale Price | Title Company |
|---|---|---|---|
| Marbut Evony | -- | American Title Co | |
| Montemayor Ricardo | -- | First American Title |
Source: Public Records
Mortgage History
| Date | Status | Borrower | Loan Amount |
|---|---|---|---|
| Open | Marbut Evony | $74,593 | |
| Previous Owner | Montemayor Ricardo | $50,511 | |
| Closed | Montemayor Ricardo | $4,930 | |
| Closed | Marbut Evony | $5,000 |
Source: Public Records
Tax History Compared to Growth
Tax History
| Year | Tax Paid | Tax Assessment Tax Assessment Total Assessment is a certain percentage of the fair market value that is determined by local assessors to be the total taxable value of land and additions on the property. | Land | Improvement |
|---|---|---|---|---|
| 2025 | $41 | $198,291 | $37,082 | $161,209 |
| 2024 | $41 | $190,443 | $35,316 | $155,127 |
| 2023 | $41 | $188,831 | $35,316 | $153,515 |
| 2022 | $3,111 | $154,838 | $30,019 | $124,819 |
| 2021 | $2,961 | $134,997 | $30,019 | $104,978 |
| 2020 | $2,829 | $122,524 | $14,715 | $107,809 |
| 2019 | $2,696 | $117,107 | $14,715 | $102,392 |
| 2018 | $913 | $100,000 | $14,715 | $85,285 |
| 2017 | $2,136 | $108,823 | $14,715 | $94,108 |
| 2016 | $1,942 | $90,382 | $14,715 | $75,667 |
| 2015 | $1,258 | $91,462 | $14,715 | $76,747 |
| 2014 | $1,258 | $76,855 | $14,715 | $62,140 |
Source: Public Records
Map
Nearby Homes
- 7318 Shady Grove Ln
- 7259 Shady Arbor Ln
- 9331 Deanwood St
- 9350 Guywood St
- 7718 Breezeway St
- 7218 Stonegate Dr
- 9207 Loren Ln
- 9523 Vanwood St
- 9214 Woodland Oaks Dr
- 8615 Black Tern Ln
- 7731 Deadwood Dr
- 7706 Deadwood Dr
- 7051 Majestic Oaks Dr
- 8007 E Oakwood Ct
- 6902 Anson Point Ln
- 8610 Twillingate Ln
- 8020 Oakwood Forest Dr
- 6407 Deirdre Anne Dr
- 7911 Battleoak Dr
- 7606 Battlepine Dr
- 9211 Guywood St
- 9203 Guywood St
- 7314 Williams St
- 9215 Guywood St
- 7403 Breezeway St
- 9214 Vanwood St
- 7318 Williams St
- 9206 Guywood St
- 9210 Guywood St
- 9202 Guywood St
- 9219 Guywood St
- 9214 Guywood St
- 7322 Williams St
- 7307 Williams St
- 9218 Vanwood St
- 7407 Breezeway St
- 7303 Williams St
- 7311 Williams St
- 9223 Guywood St
- 9218 Guywood St