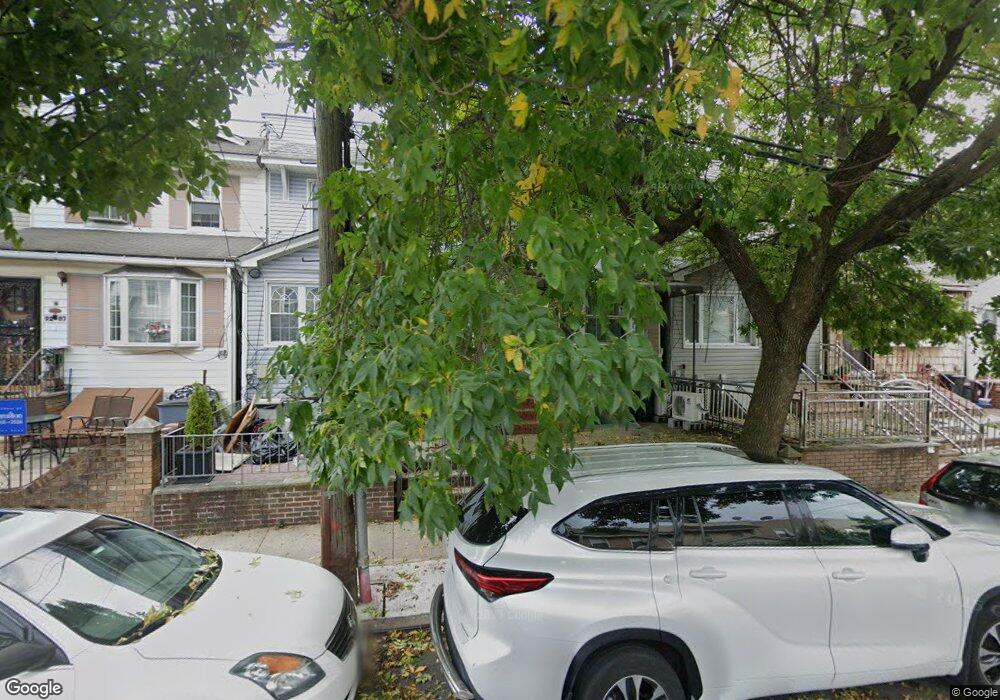
9209 92nd St Woodhaven, NY 11421
Woodhaven NeighborhoodEstimated Value: $676,000 - $779,000
--
Bed
--
Bath
1,292
Sq Ft
$570/Sq Ft
Est. Value
About This Home
This home is located at 9209 92nd St, Woodhaven, NY 11421 and is currently estimated at $736,377, approximately $569 per square foot. 9209 92nd St is a home located in Queens County with nearby schools including New York City Academy For Discovery, Jhs 210 Elizabeth Blackwell, and St. Thomas the Apostle Catholic Academy.
Ownership History
Date
Name
Owned For
Owner Type
Purchase Details
Closed on
Oct 1, 1997
Sold by
Salazar Gustavo
Bought by
Ramos Samuel and Ramos Marie
Current Estimated Value
Home Financials for this Owner
Home Financials are based on the most recent Mortgage that was taken out on this home.
Original Mortgage
$131,900
Outstanding Balance
$20,709
Interest Rate
7.19%
Mortgage Type
FHA
Estimated Equity
$715,668
Create a Home Valuation Report for This Property
The Home Valuation Report is an in-depth analysis detailing your home's value as well as a comparison with similar homes in the area
Home Values in the Area
Average Home Value in this Area
Purchase History
| Date | Buyer | Sale Price | Title Company |
|---|---|---|---|
| Ramos Samuel | $133,000 | Chicago Title Insurance Co |
Source: Public Records
Mortgage History
| Date | Status | Borrower | Loan Amount |
|---|---|---|---|
| Open | Ramos Samuel | $131,900 |
Source: Public Records
Tax History Compared to Growth
Tax History
| Year | Tax Paid | Tax Assessment Tax Assessment Total Assessment is a certain percentage of the fair market value that is determined by local assessors to be the total taxable value of land and additions on the property. | Land | Improvement |
|---|---|---|---|---|
| 2025 | $5,073 | $27,475 | $7,731 | $19,744 |
| 2024 | $5,085 | $26,656 | $8,290 | $18,366 |
| 2023 | $4,814 | $25,367 | $7,416 | $17,951 |
| 2022 | $4,519 | $38,220 | $11,700 | $26,520 |
| 2021 | $4,522 | $37,620 | $11,700 | $25,920 |
| 2020 | $4,550 | $39,600 | $11,700 | $27,900 |
| 2019 | $4,354 | $39,840 | $11,700 | $28,140 |
| 2018 | $4,012 | $21,139 | $6,791 | $14,348 |
| 2017 | $3,790 | $20,062 | $8,431 | $11,631 |
| 2016 | $3,504 | $20,062 | $8,431 | $11,631 |
| 2015 | $2,063 | $19,080 | $10,429 | $8,651 |
| 2014 | $2,063 | $18,511 | $11,412 | $7,099 |
Source: Public Records
Map
Nearby Homes