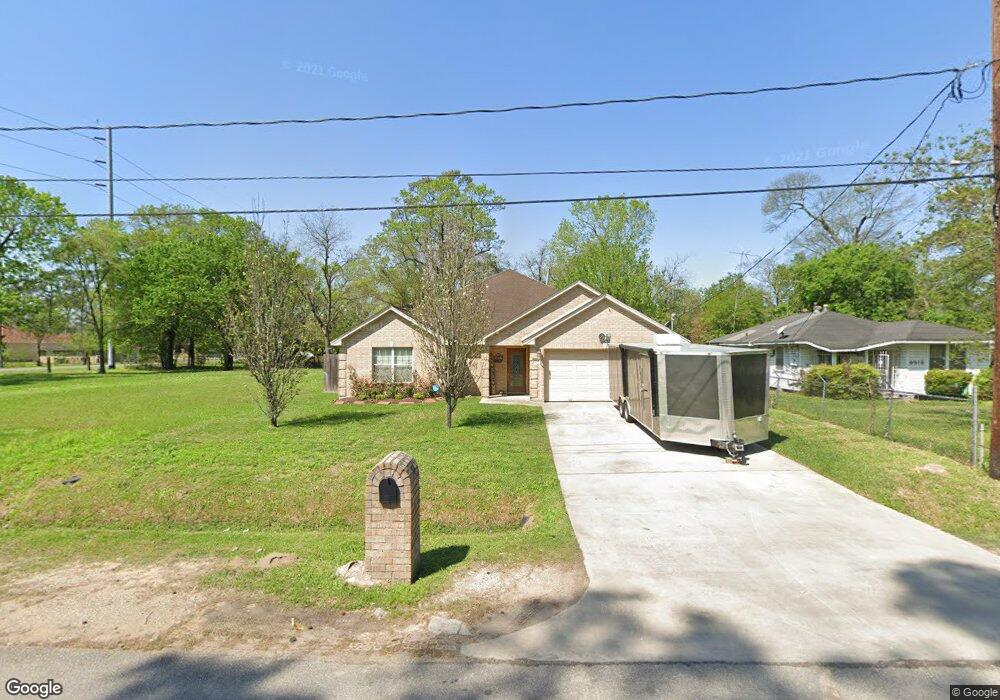
9209 Spaulding St Houston, TX 77016
Trinity-Houston Gardens NeighborhoodEstimated Value: $221,000 - $308,000
3
Beds
3
Baths
2,401
Sq Ft
$112/Sq Ft
Est. Value
About This Home
This home is located at 9209 Spaulding St, Houston, TX 77016 and is currently estimated at $267,772, approximately $111 per square foot. 9209 Spaulding St is a home located in Harris County with nearby schools including Shadydale Elementary School, Forest Brook Middle, and North Forest High School.
Ownership History
Date
Name
Owned For
Owner Type
Purchase Details
Closed on
Dec 30, 2016
Sold by
Jp Morgan Chase Bank
Bought by
Zhang Zuoliang
Current Estimated Value
Purchase Details
Closed on
Sep 6, 2016
Sold by
Ellis Gregory and Ellis Jacqueline
Bought by
Jpmorgan Chase Bank Na
Purchase Details
Closed on
Sep 23, 2011
Sold by
Ellis Jacqueline S
Bought by
Ellis Gregory L
Purchase Details
Closed on
Jun 27, 2008
Sold by
Walter Kevin V and Walter Tracey N
Bought by
Ellis Gregory and Ellis Jacqueline
Home Financials for this Owner
Home Financials are based on the most recent Mortgage that was taken out on this home.
Original Mortgage
$129,960
Interest Rate
5.99%
Mortgage Type
FHA
Purchase Details
Closed on
Dec 28, 2005
Sold by
Johnson Terry
Bought by
Windham Harvey Barker
Purchase Details
Closed on
Sep 15, 2005
Sold by
Johnson Terry
Bought by
County Of Harris
Create a Home Valuation Report for This Property
The Home Valuation Report is an in-depth analysis detailing your home's value as well as a comparison with similar homes in the area
Home Values in the Area
Average Home Value in this Area
Purchase History
| Date | Buyer | Sale Price | Title Company |
|---|---|---|---|
| Zhang Zuoliang | -- | None Available | |
| Jpmorgan Chase Bank Na | $124,670 | None Available | |
| Ellis Gregory L | -- | None Available | |
| Ellis Gregory | -- | American Title Company | |
| Windham Harvey Barker | $6,500 | None Available | |
| County Of Harris | -- | -- |
Source: Public Records
Mortgage History
| Date | Status | Borrower | Loan Amount |
|---|---|---|---|
| Previous Owner | Ellis Gregory | $129,960 |
Source: Public Records
Tax History Compared to Growth
Tax History
| Year | Tax Paid | Tax Assessment Tax Assessment Total Assessment is a certain percentage of the fair market value that is determined by local assessors to be the total taxable value of land and additions on the property. | Land | Improvement |
|---|---|---|---|---|
| 2025 | $5,068 | $237,671 | $51,795 | $185,876 |
| 2024 | $5,068 | $242,213 | $51,795 | $190,418 |
| 2023 | $5,068 | $362,273 | $38,846 | $323,427 |
| 2022 | $6,250 | $250,000 | $25,898 | $224,102 |
| 2021 | $5,472 | $234,781 | $17,265 | $217,516 |
| 2020 | $4,238 | $204,437 | $17,265 | $187,172 |
| 2019 | $4,959 | $195,970 | $13,812 | $182,158 |
| 2018 | $3,310 | $130,800 | $13,812 | $116,988 |
| 2017 | $3,307 | $130,800 | $13,812 | $116,988 |
| 2016 | $2,383 | $115,969 | $10,791 | $105,178 |
| 2015 | $1,591 | $85,663 | $9,927 | $75,736 |
| 2014 | $1,591 | $85,663 | $9,927 | $75,736 |
Source: Public Records
Map
Nearby Homes
- 9205 & 9207 Spaulding St
- 9227 Homestead Rd
- 9317 Homestead Rd
- 9009 Compton St
- 8914 Lanewood Dr
- 5009 Tidwell Rd
- 6110 Tidwell Rd
- 8928 Homestead Rd
- 6226 E Tidwell Rd
- 8504 Shady Dr
- 9316 Sundown Dr
- 6415 Laura Koppe Rd
- 6513 Laura Koppe Rd
- 6206 Antha St
- 9412 Crofton St
- 6320 Laura Koppe Rd
- 0 Crofton St
- 9603 Homestead Rd
- 6213 Laura Koppe Rd
- 8700 Lanewood Dr
- 9213 Spaulding St
- 0 Spaulding St Unit 77242044
- 0 Spaulding St Unit 45695097
- 0 Spaulding St Unit 52029068
- 9215 Spaulding St
- 9212 Lanewood Dr
- 9206 Lanewood Dr
- 9214 Lanewood Dr
- 9202 Lanewood Dr
- 9210 Spaulding St
- 9221 Spaulding St
- 9214 Spaulding St
- 9206 Spaulding St
- 6514 Firnat St
- 9202 Spaulding St
- 9218 Spaulding St
- 9226 Lanewood Dr
- 9220 Spaulding St
- 6502 Firnat St
- 9117 Spaulding St