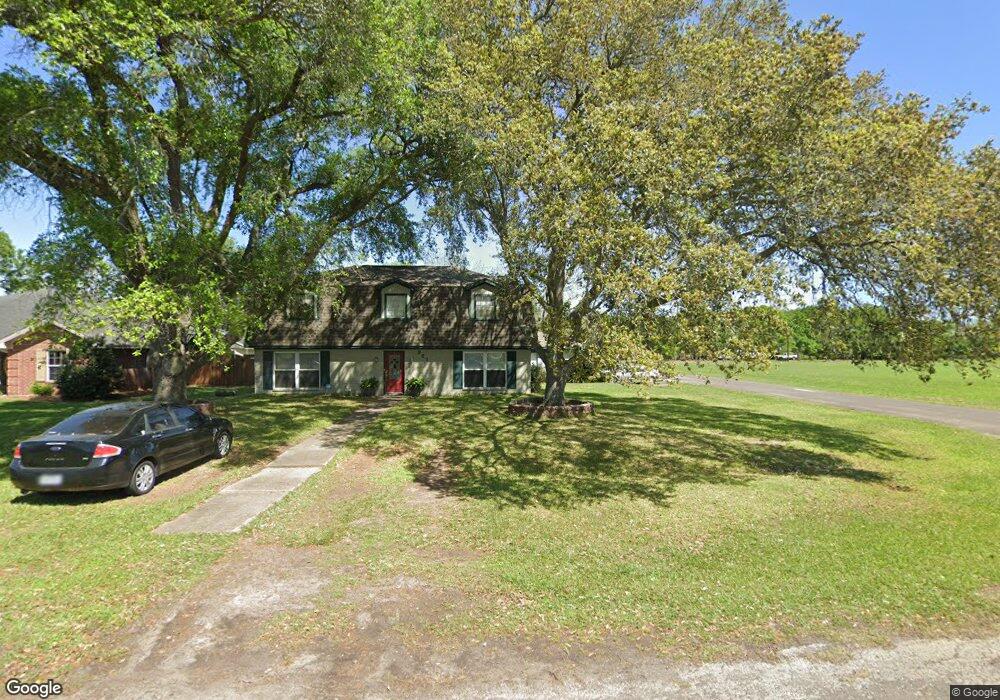
921 3rd St Bay City, TX 77414
Estimated Value: $266,291 - $325,000
5
Beds
2
Baths
3,300
Sq Ft
$90/Sq Ft
Est. Value
About This Home
This home is located at 921 3rd St, Bay City, TX 77414 and is currently estimated at $295,573, approximately $89 per square foot. 921 3rd St is a home located in Matagorda County with nearby schools including John H. Cherry Elementary School, Bay City Junior High School, and Bay City High School.
Ownership History
Date
Name
Owned For
Owner Type
Purchase Details
Closed on
Nov 3, 2006
Sold by
Findley Alan Trent and Findley Beckie Renee
Bought by
Page James L and Page Sandra L
Current Estimated Value
Purchase Details
Closed on
Jul 15, 2005
Sold by
Proveaux Archie V and Proveaux Bertha S
Bought by
Hodges John H and Hodges Cynthia R
Home Financials for this Owner
Home Financials are based on the most recent Mortgage that was taken out on this home.
Original Mortgage
$156,075
Interest Rate
5.64%
Mortgage Type
New Conventional
Create a Home Valuation Report for This Property
The Home Valuation Report is an in-depth analysis detailing your home's value as well as a comparison with similar homes in the area
Home Values in the Area
Average Home Value in this Area
Purchase History
| Date | Buyer | Sale Price | Title Company |
|---|---|---|---|
| Page James L | -- | -- | |
| Hodges John H | -- | -- |
Source: Public Records
Mortgage History
| Date | Status | Borrower | Loan Amount |
|---|---|---|---|
| Previous Owner | Hodges John H | $156,075 |
Source: Public Records
Tax History Compared to Growth
Tax History
| Year | Tax Paid | Tax Assessment Tax Assessment Total Assessment is a certain percentage of the fair market value that is determined by local assessors to be the total taxable value of land and additions on the property. | Land | Improvement |
|---|---|---|---|---|
| 2024 | $68 | $289,800 | $30,000 | $259,800 |
| 2023 | $6,258 | $297,840 | $21,980 | $275,860 |
| 2022 | $6,520 | $261,170 | $21,980 | $239,190 |
| 2021 | $6,522 | $258,550 | $21,980 | $236,570 |
| 2020 | $6,167 | $201,790 | $21,980 | $179,810 |
| 2019 | $6,228 | $203,890 | $21,980 | $181,910 |
| 2018 | $5,833 | $197,980 | $21,980 | $176,000 |
| 2017 | $5,583 | $199,970 | $21,980 | $177,990 |
| 2016 | $5,639 | $201,960 | $21,980 | $179,980 |
| 2015 | -- | $189,960 | $21,980 | $167,980 |
| 2014 | -- | $184,260 | $21,980 | $162,280 |
Source: Public Records
Map
Nearby Homes