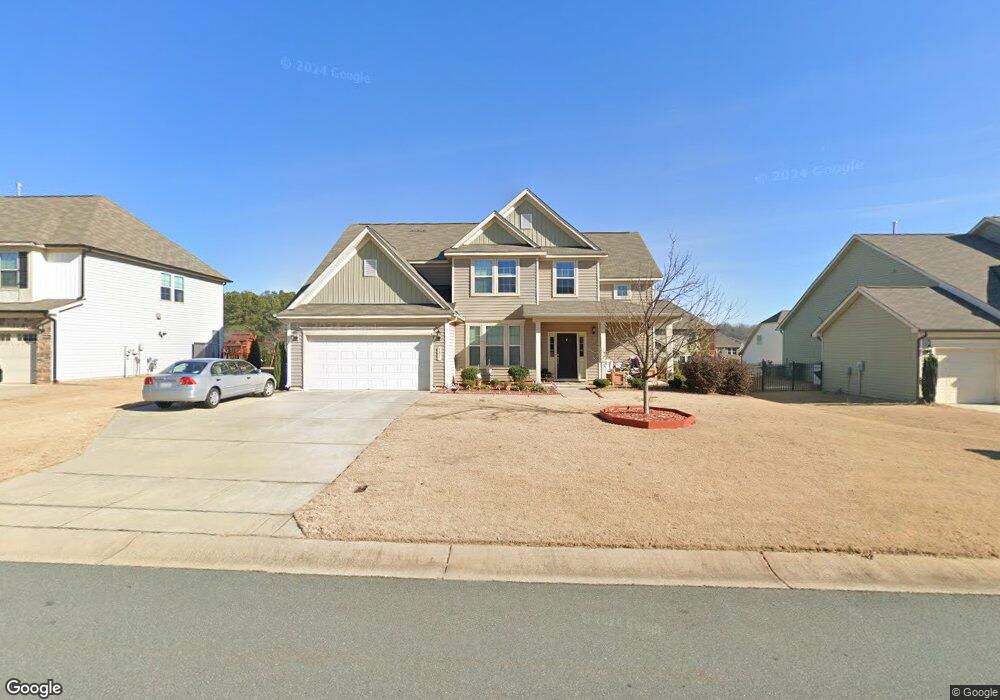
921 Beech Glen Dr Mebane, NC 27302
Estimated Value: $421,000 - $462,000
4
Beds
3
Baths
2,572
Sq Ft
$170/Sq Ft
Est. Value
About This Home
This home is located at 921 Beech Glen Dr, Mebane, NC 27302 and is currently estimated at $436,087, approximately $169 per square foot. 921 Beech Glen Dr is a home located in Alamance County with nearby schools including South Mebane Elementary School, Woodlawn Middle School, and Bradford Academy.
Ownership History
Date
Name
Owned For
Owner Type
Purchase Details
Closed on
Aug 30, 2019
Sold by
Elliott Jon and Elliott Marisa
Bought by
Anju Medayil Jibin Joy and Anju Jose
Current Estimated Value
Home Financials for this Owner
Home Financials are based on the most recent Mortgage that was taken out on this home.
Original Mortgage
$250,000
Outstanding Balance
$219,871
Interest Rate
3.8%
Estimated Equity
$216,216
Purchase Details
Closed on
Aug 31, 2015
Sold by
Dan Ryan Builders-North Carolina Llc
Bought by
Elliott Jon and Elliott Marisa
Home Financials for this Owner
Home Financials are based on the most recent Mortgage that was taken out on this home.
Original Mortgage
$234,300
Interest Rate
4.16%
Mortgage Type
New Conventional
Purchase Details
Closed on
May 8, 2015
Sold by
Mebane 8540 Llc
Bought by
Dan Ryan Builders North Caroli
Create a Home Valuation Report for This Property
The Home Valuation Report is an in-depth analysis detailing your home's value as well as a comparison with similar homes in the area
Home Values in the Area
Average Home Value in this Area
Purchase History
| Date | Buyer | Sale Price | Title Company |
|---|---|---|---|
| Anju Medayil Jibin Joy | $290,000 | Attorney | |
| Elliott Jon | $233,000 | None Available | |
| Dan Ryan Builders North Caroli | $54,000 | -- |
Source: Public Records
Mortgage History
| Date | Status | Borrower | Loan Amount |
|---|---|---|---|
| Open | Anju Medayil Jibin Joy | $250,000 | |
| Previous Owner | Elliott Jon | $234,300 |
Source: Public Records
Tax History Compared to Growth
Tax History
| Year | Tax Paid | Tax Assessment Tax Assessment Total Assessment is a certain percentage of the fair market value that is determined by local assessors to be the total taxable value of land and additions on the property. | Land | Improvement |
|---|---|---|---|---|
| 2025 | $3,909 | $452,481 | $55,000 | $397,481 |
| 2024 | $3,796 | $452,481 | $55,000 | $397,481 |
| 2023 | $3,611 | $452,481 | $55,000 | $397,481 |
| 2022 | $2,701 | $242,344 | $40,000 | $202,344 |
| 2021 | $2,711 | $242,344 | $40,000 | $202,344 |
| 2020 | $2,749 | $242,344 | $40,000 | $202,344 |
| 2019 | $2,763 | $242,344 | $40,000 | $202,344 |
| 2018 | $0 | $242,344 | $40,000 | $202,344 |
| 2017 | $2,545 | $242,344 | $40,000 | $202,344 |
| 2016 | $2,525 | $235,998 | $40,000 | $195,998 |
| 2015 | -- | $34,000 | $34,000 | $0 |
| 2014 | -- | $34,000 | $34,000 | $0 |
Source: Public Records
Map
Nearby Homes
- 705 Avalon Dr
- 917 Avalon Dr
- 715 Fairway Dr
- 517 Eagles Way
- 502 Fairway Dr
- 180 Parker Ln
- 214 Parker Ln
- 198 Parker Ln
- 862 Pryor St
- 186 Parker Ln
- 177 Parker Ln
- 196 Parker Ln
- The Gibsonville Plan at The Townes at Oakwood Square
- The Elon Plan at The Townes at Oakwood Square
- The Burlington Plan at The Townes at Oakwood Square
- The Carrboro Plan at The Townes at Oakwood Square
- 816 Pryor St Unit 54
- 128 Parker Ln
- 804 Pryor St Unit 49
- 154 Parker Ln
- 923 Beech Glen Dr
- 919 Beech Glen Dr
- 906 Avalon Dr
- 916 Beech Glen Dr
- 902 Beech Glen Dr
- 917 Beech Glen Dr
- 902 Avalon Dr
- 918 Beech Glen Dr
- 914 Beech Glen Dr
- 908 Avalon Dr
- 801 Beech Glen Ct
- 915 Beech Glen Dr
- 910 Avalon Dr
- 800 Beech Glen Dr
- 903 Avalon Dr
- 702 Fairway Dr
- 704 Fairway Dr
- 910 Beech Glen Dr
- 905 Avalon Dr
- 803 Beech Glen Dr