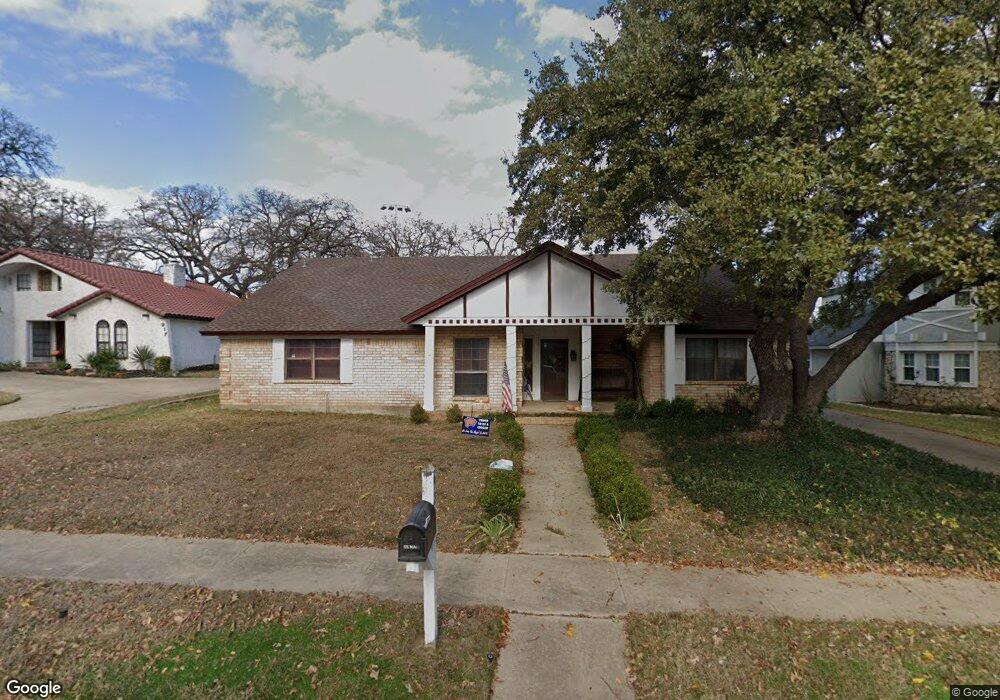
921 Brestol Ct W Bedford, TX 76021
Estimated Value: $411,000 - $483,000
3
Beds
2
Baths
2,132
Sq Ft
$211/Sq Ft
Est. Value
About This Home
This home is located at 921 Brestol Ct W, Bedford, TX 76021 and is currently estimated at $449,599, approximately $210 per square foot. 921 Brestol Ct W is a home located in Tarrant County with nearby schools including Bedford Heights Elementary School, Bedford Junior High School, and L.D. Bell High School.
Ownership History
Date
Name
Owned For
Owner Type
Purchase Details
Closed on
Jul 13, 2018
Sold by
My Flipping Family Llc
Bought by
Hamlin Michael C and Hamlin Jennifer E
Current Estimated Value
Home Financials for this Owner
Home Financials are based on the most recent Mortgage that was taken out on this home.
Original Mortgage
$270,750
Outstanding Balance
$234,645
Interest Rate
4.5%
Mortgage Type
New Conventional
Estimated Equity
$214,954
Purchase Details
Closed on
May 16, 2018
Sold by
Tingley Wally and Tingley Richard L
Bought by
My Flipping Family Llc
Home Financials for this Owner
Home Financials are based on the most recent Mortgage that was taken out on this home.
Original Mortgage
$270,750
Outstanding Balance
$234,645
Interest Rate
4.5%
Mortgage Type
New Conventional
Estimated Equity
$214,954
Purchase Details
Closed on
Jun 23, 2008
Sold by
Tingley Betty Jean
Bought by
Tingley Wally and Tingley Richard L
Create a Home Valuation Report for This Property
The Home Valuation Report is an in-depth analysis detailing your home's value as well as a comparison with similar homes in the area
Home Values in the Area
Average Home Value in this Area
Purchase History
| Date | Buyer | Sale Price | Title Company |
|---|---|---|---|
| Hamlin Michael C | -- | None Available | |
| My Flipping Family Llc | -- | None Available | |
| Tingley Wally | -- | None Available |
Source: Public Records
Mortgage History
| Date | Status | Borrower | Loan Amount |
|---|---|---|---|
| Open | Hamlin Michael C | $270,750 | |
| Previous Owner | My Flipping Family Llc | $200,000 |
Source: Public Records
Tax History Compared to Growth
Tax History
| Year | Tax Paid | Tax Assessment Tax Assessment Total Assessment is a certain percentage of the fair market value that is determined by local assessors to be the total taxable value of land and additions on the property. | Land | Improvement |
|---|---|---|---|---|
| 2025 | $6,653 | $409,839 | $80,000 | $329,839 |
| 2024 | $6,653 | $409,839 | $80,000 | $329,839 |
| 2023 | $7,217 | $376,264 | $60,000 | $316,264 |
| 2022 | $7,592 | $350,554 | $60,000 | $290,554 |
| 2021 | $7,444 | $315,998 | $60,000 | $255,998 |
| 2020 | $6,848 | $288,041 | $60,000 | $228,041 |
| 2019 | $7,044 | $289,957 | $60,000 | $229,957 |
| 2018 | $1,597 | $254,572 | $60,000 | $194,572 |
| 2017 | $5,651 | $241,705 | $30,000 | $211,705 |
| 2016 | $5,137 | $215,210 | $30,000 | $185,210 |
| 2015 | $1,559 | $202,805 | $30,000 | $172,805 |
| 2014 | $1,559 | $175,500 | $20,000 | $155,500 |
Source: Public Records
Map
Nearby Homes
- 909 Brestol Ct W
- 3624 Wayne Ct
- 3609 Wayne Ct
- 1109 Simpson Terrace
- 628 Huntwich Dr
- 3605 Spring Valley Dr
- 1136 Wingate Dr
- 4002 Copperwood Ct
- 3907 Copperwood Ct
- 913 Kensington Ct
- 4105 Inwood Ln
- 1209 Hillandale Ct
- 3301 Wendover Ct
- 1303 Crest Dr
- 3213 Spring Valley Dr
- 405 Woodbriar Ct
- 3119 Spring Grove Dr
- 1421 Plantation Dr N
- 305 Warbler Dr
- 801 Shady Creek Ln
- 917 Brestol Ct W
- 925 Brestol Ct W
- 916 Brestol Ct W
- 920 Brestol Ct W
- 920 Brestol Ct W
- 912 Brestol Ct W
- 3709 Wayne Dr
- 901 Brestol Ct E
- 908 Brestol Ct W
- 900 Brestol Ct E
- 904 Brestol Ct W
- 921 Harwood Terrace
- 905 Brestol Ct W
- 925 Harwood Terrace
- 905 Brestol Ct E
- 917 Harwood Terrace
- 3708 Wayne Dr
- 901 Brestol Ct W
- 913 Harwood Terrace
- 904 Brestol Ct E