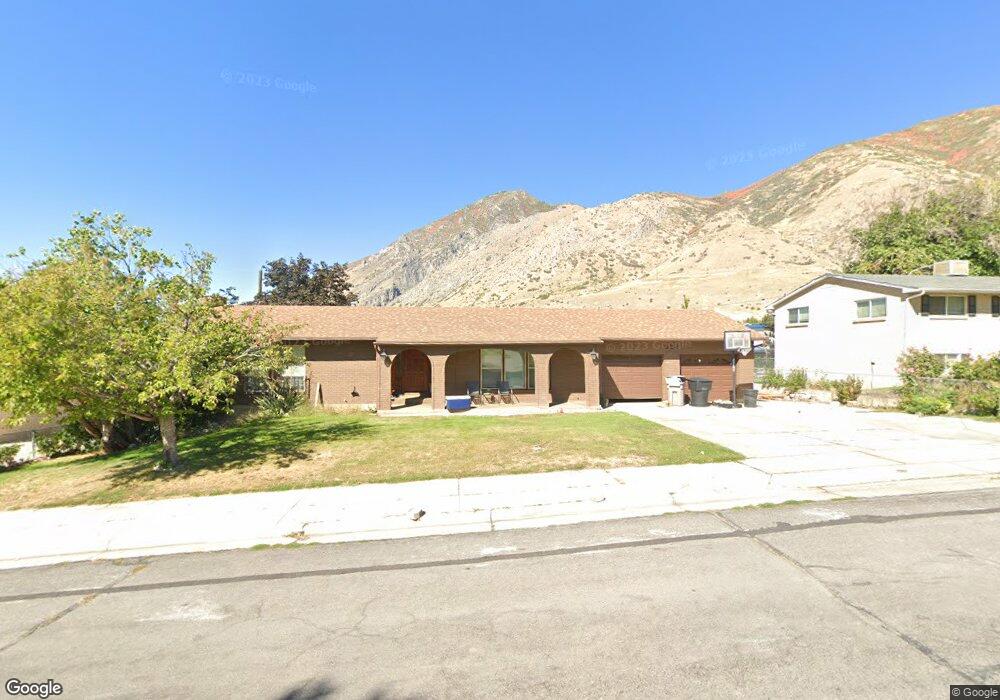
921 E 100 S Springville, UT 84663
Estimated Value: $537,000 - $684,000
4
Beds
3
Baths
2,906
Sq Ft
$205/Sq Ft
Est. Value
About This Home
This home is located at 921 E 100 S, Springville, UT 84663 and is currently estimated at $596,314, approximately $205 per square foot. 921 E 100 S is a home located in Utah County with nearby schools including Brookside School, Springville Junior High School, and Springville High School.
Ownership History
Date
Name
Owned For
Owner Type
Purchase Details
Closed on
May 12, 2020
Sold by
Jessop Jared
Bought by
Jessop Jared and Jessop Julie C
Current Estimated Value
Home Financials for this Owner
Home Financials are based on the most recent Mortgage that was taken out on this home.
Original Mortgage
$268,000
Outstanding Balance
$237,485
Interest Rate
3.3%
Mortgage Type
New Conventional
Estimated Equity
$358,829
Purchase Details
Closed on
Jul 15, 2015
Sold by
Waite Gary F and Waite Lila M
Bought by
Jessop Jared and Jessop Julie C
Purchase Details
Closed on
Oct 15, 1996
Sold by
Waite Gary F
Bought by
Waite Gary F and Waite Lilam
Home Financials for this Owner
Home Financials are based on the most recent Mortgage that was taken out on this home.
Original Mortgage
$44,000
Interest Rate
8.37%
Create a Home Valuation Report for This Property
The Home Valuation Report is an in-depth analysis detailing your home's value as well as a comparison with similar homes in the area
Home Values in the Area
Average Home Value in this Area
Purchase History
| Date | Buyer | Sale Price | Title Company |
|---|---|---|---|
| Jessop Jared | -- | First Title Insurance Agency | |
| Jessop Jared | -- | First Title Insurance Agency | |
| Jessop Jared | -- | Northwest Title Ins Age | |
| Waite Gary F | -- | -- | |
| Waite Gary F | -- | -- |
Source: Public Records
Mortgage History
| Date | Status | Borrower | Loan Amount |
|---|---|---|---|
| Open | Jessop Jared | $268,000 | |
| Previous Owner | Waite Gary F | $44,000 |
Source: Public Records
Tax History
| Year | Tax Paid | Tax Assessment Tax Assessment Total Assessment is a certain percentage of the fair market value that is determined by local assessors to be the total taxable value of land and additions on the property. | Land | Improvement |
|---|---|---|---|---|
| 2025 | $2,645 | $289,190 | -- | -- |
| 2024 | $2,645 | $270,985 | $0 | $0 |
| 2023 | $2,579 | $264,495 | $0 | $0 |
| 2022 | $2,590 | $260,810 | $0 | $0 |
| 2021 | $2,298 | $360,200 | $118,800 | $241,400 |
| 2020 | $2,090 | $317,700 | $88,000 | $229,700 |
| 2019 | $1,959 | $303,100 | $73,400 | $229,700 |
| 2018 | $1,815 | $267,900 | $68,200 | $199,700 |
| 2017 | $1,662 | $130,295 | $0 | $0 |
| 2016 | $1,501 | $115,390 | $0 | $0 |
| 2015 | $1,317 | $103,510 | $0 | $0 |
| 2014 | $1,231 | $96,140 | $0 | $0 |
Source: Public Records
Map
Nearby Homes
- 1130 Hillcrest Dr
- 1185 Hillcrest Dr
- 1062 E 350 S
- 805 E 400 S
- 802 S Brookside Dr
- 1027 E 200 N
- 926 E 250 N
- 616 E Aaron Ave
- 1361 E 400 S
- 645 Swenson Ave Unit 5
- 645 Swenson Ave Unit 3
- 647 Swenson Ave Unit 3
- 711 E 400 N
- 883 E 700 S
- 445 E 535 S
- 380 E 200 N
- 437 N 650 St E
- 557 S 1470 E
- 585 S 400 E
- 30 N 200 E
Your Personal Tour Guide
Ask me questions while you tour the home.