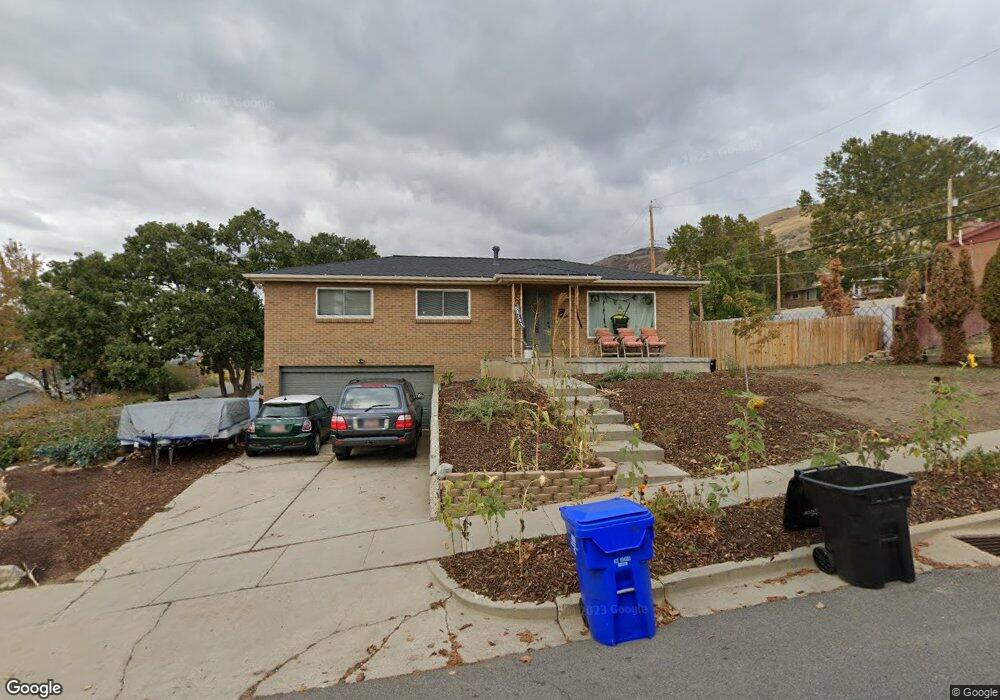
921 E 900 N Bountiful, UT 84010
Estimated Value: $514,000 - $594,000
4
Beds
2
Baths
1,763
Sq Ft
$308/Sq Ft
Est. Value
About This Home
This home is located at 921 E 900 N, Bountiful, UT 84010 and is currently estimated at $543,383, approximately $308 per square foot. 921 E 900 N is a home located in Davis County with nearby schools including Tolman School, Bountiful Junior High School, and Viewmont High School.
Ownership History
Date
Name
Owned For
Owner Type
Purchase Details
Closed on
Feb 7, 2023
Sold by
Gentry Chase
Bought by
Walsh Smith Sydney and Walsh Evan Smith
Current Estimated Value
Home Financials for this Owner
Home Financials are based on the most recent Mortgage that was taken out on this home.
Original Mortgage
$388,350
Outstanding Balance
$375,183
Interest Rate
6.09%
Mortgage Type
New Conventional
Estimated Equity
$168,200
Purchase Details
Closed on
Dec 27, 2019
Sold by
Mckeeth Nathan
Bought by
Gentry Chase and Gentry Anna Corinne
Home Financials for this Owner
Home Financials are based on the most recent Mortgage that was taken out on this home.
Original Mortgage
$378,026
Interest Rate
3.75%
Mortgage Type
FHA
Purchase Details
Closed on
Dec 14, 2018
Sold by
Wilson Michael C
Bought by
Mckeeth Nathan
Home Financials for this Owner
Home Financials are based on the most recent Mortgage that was taken out on this home.
Original Mortgage
$191,250
Interest Rate
4.8%
Mortgage Type
New Conventional
Purchase Details
Closed on
May 31, 2007
Sold by
Thomas Devon A
Bought by
Thomas Devon A and Marshall Debra D
Create a Home Valuation Report for This Property
The Home Valuation Report is an in-depth analysis detailing your home's value as well as a comparison with similar homes in the area
Purchase History
| Date | Buyer | Sale Price | Title Company |
|---|---|---|---|
| Walsh Smith Sydney | -- | Backman Title Services | |
| Gentry Chase | -- | Benchmark Title Ins | |
| Mckeeth Nathan | -- | Stewart Title Ins A | |
| Thomas Devon A | -- | None Available |
Source: Public Records
Mortgage History
| Date | Status | Borrower | Loan Amount |
|---|---|---|---|
| Open | Walsh Smith Sydney | $388,350 | |
| Previous Owner | Gentry Chase | $378,026 | |
| Previous Owner | Mckeeth Nathan | $191,250 |
Source: Public Records
Tax History
| Year | Tax Paid | Tax Assessment Tax Assessment Total Assessment is a certain percentage of the fair market value that is determined by local assessors to be the total taxable value of land and additions on the property. | Land | Improvement |
|---|---|---|---|---|
| 2025 | $3,018 | $270,600 | $133,242 | $137,358 |
| 2024 | $2,841 | $264,550 | $122,754 | $141,796 |
| 2023 | $2,788 | $472,000 | $223,829 | $248,171 |
| 2022 | $2,913 | $271,150 | $125,644 | $145,506 |
| 2021 | $2,639 | $376,000 | $186,856 | $189,144 |
| 2020 | $2,477 | $342,000 | $170,113 | $171,887 |
| 2019 | $2,040 | $268,000 | $164,649 | $103,351 |
| 2018 | $1,904 | $241,000 | $153,344 | $87,656 |
| 2016 | $1,670 | $113,465 | $50,153 | $63,312 |
| 2015 | $1,614 | $111,430 | $49,725 | $61,705 |
| 2014 | $1,668 | $119,279 | $49,725 | $69,554 |
| 2013 | -- | $113,522 | $51,700 | $61,822 |
Source: Public Records
Map
Nearby Homes
- 908 Northern Hills Dr Unit 3
- 933 Northern Hills Cir
- 129 N 800 E
- 513 N 400 E Unit 14B
- 683 E 100 N
- 6 N 800 E
- 453 N 400 E Unit 7-D
- 978 N 170 E
- 1342 E Skyline Dr N Unit 30
- 214 E 1250 N
- 1138 Briggs Dr
- 698 E 200 S
- 1420 N Main St
- 610 S 800 E
- 17 E 400 N Unit 19B
- 111 Eagle Ridge Dr
- 967 S Courtyard Ln
- 207 E 820 S
- 49 E 200 N Unit 4
- 41 E 200 N Unit 6
Your Personal Tour Guide
Ask me questions while you tour the home.