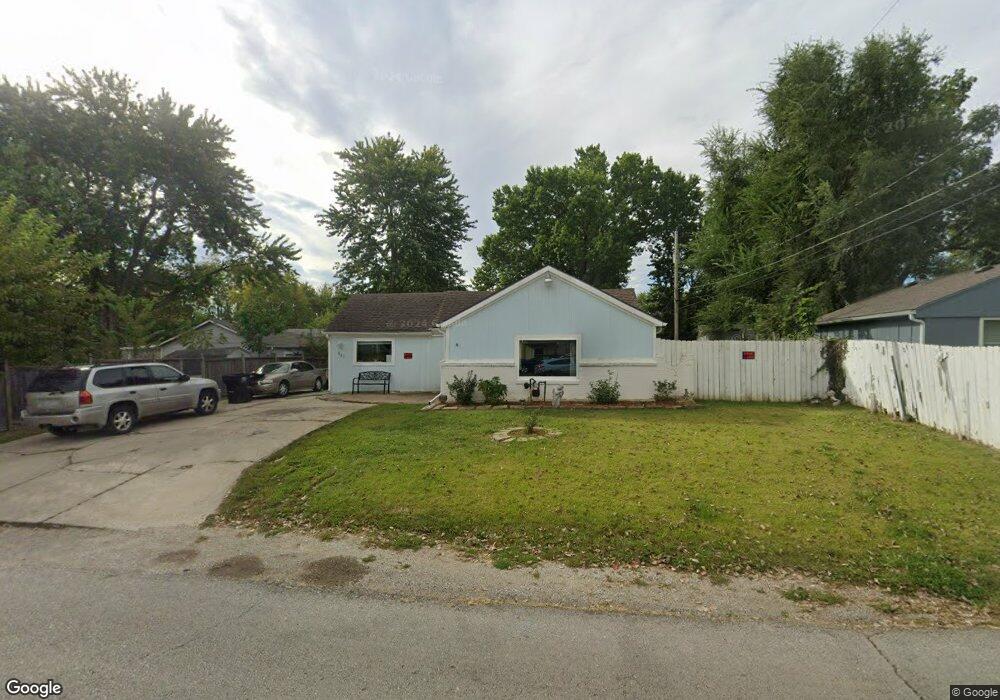
921 E Hayward Ave Independence, MO 64050
Benton NeighborhoodEstimated Value: $136,000 - $164,439
2
Beds
1
Bath
1,482
Sq Ft
$103/Sq Ft
Est. Value
About This Home
This home is located at 921 E Hayward Ave, Independence, MO 64050 and is currently estimated at $152,110, approximately $102 per square foot. 921 E Hayward Ave is a home located in Jackson County with nearby schools including Thomas Hart Benton Elementary School, Bridger Middle School, and Bingham Middle School.
Ownership History
Date
Name
Owned For
Owner Type
Purchase Details
Closed on
Sep 23, 2024
Sold by
Juarbe Carmen Cameron
Bought by
Juarbe Anthony and Hernandez Cynthia Cameron
Current Estimated Value
Purchase Details
Closed on
Jan 16, 2015
Sold by
Juarbe Carmen C
Bought by
Juarbe Carmen C and Cameron Manuel C
Purchase Details
Closed on
Mar 7, 2011
Sold by
Flatirons Financial Inc
Bought by
Juarbe Carmen C
Purchase Details
Closed on
Apr 22, 2010
Sold by
Wilson Kansas City Holdings Ii Llc and Buscemi Salvatore M
Bought by
Flatirons Financial Inc
Home Financials for this Owner
Home Financials are based on the most recent Mortgage that was taken out on this home.
Original Mortgage
$35,000,000
Interest Rate
4.93%
Mortgage Type
Future Advance Clause Open End Mortgage
Purchase Details
Closed on
Jan 2, 2009
Sold by
Flatirons Financial Inc
Bought by
Wilson Kansas City Holdings Ii Llc
Home Financials for this Owner
Home Financials are based on the most recent Mortgage that was taken out on this home.
Original Mortgage
$36,816
Interest Rate
5.09%
Mortgage Type
Seller Take Back
Purchase Details
Closed on
Jul 30, 2008
Sold by
Willis Anne
Bought by
Flatirons Financial Inc
Home Financials for this Owner
Home Financials are based on the most recent Mortgage that was taken out on this home.
Original Mortgage
$30,000
Interest Rate
6.08%
Mortgage Type
Stand Alone Second
Purchase Details
Closed on
Jun 21, 2007
Sold by
Transon Relations Investment Group Llc
Bought by
Willis Anne
Home Financials for this Owner
Home Financials are based on the most recent Mortgage that was taken out on this home.
Original Mortgage
$54,600
Interest Rate
6.19%
Mortgage Type
Purchase Money Mortgage
Purchase Details
Closed on
May 23, 2007
Sold by
Us Bank Na
Bought by
Transon Relations Investment Group Llc
Home Financials for this Owner
Home Financials are based on the most recent Mortgage that was taken out on this home.
Original Mortgage
$54,600
Interest Rate
6.19%
Mortgage Type
Purchase Money Mortgage
Purchase Details
Closed on
Oct 5, 2006
Sold by
Mattke James W and Mattke Carol
Bought by
Us Bank Na
Purchase Details
Closed on
Aug 26, 2005
Sold by
Mattke Clifford D and Mattke Deborah
Bought by
Mattke James W and Mattke Carol
Home Financials for this Owner
Home Financials are based on the most recent Mortgage that was taken out on this home.
Original Mortgage
$67,575
Interest Rate
5.81%
Mortgage Type
Fannie Mae Freddie Mac
Create a Home Valuation Report for This Property
The Home Valuation Report is an in-depth analysis detailing your home's value as well as a comparison with similar homes in the area
Home Values in the Area
Average Home Value in this Area
Purchase History
| Date | Buyer | Sale Price | Title Company |
|---|---|---|---|
| Juarbe Anthony | -- | None Listed On Document | |
| Juarbe Carmen C | -- | None Available | |
| Juarbe Carmen C | -- | None Available | |
| Flatirons Financial Inc | $22,625 | None Available | |
| Wilson Kansas City Holdings Ii Llc | -- | None Available | |
| Flatirons Financial Inc | $45,841 | None Available | |
| Willis Anne | -- | None Available | |
| Transon Relations Investment Group Llc | -- | Chicago Title Insurance Co | |
| Us Bank Na | $68,000 | Continental Title Company | |
| Mattke James W | -- | Ctic |
Source: Public Records
Mortgage History
| Date | Status | Borrower | Loan Amount |
|---|---|---|---|
| Previous Owner | Flatirons Financial Inc | $35,000,000 | |
| Previous Owner | Wilson Kansas City Holdings Ii Llc | $36,816 | |
| Previous Owner | Flatirons Financial Inc | $30,000 | |
| Previous Owner | Willis Anne | $54,600 | |
| Previous Owner | Mattke James W | $67,575 |
Source: Public Records
Tax History
| Year | Tax Paid | Tax Assessment Tax Assessment Total Assessment is a certain percentage of the fair market value that is determined by local assessors to be the total taxable value of land and additions on the property. | Land | Improvement |
|---|---|---|---|---|
| 2025 | $1,382 | $18,342 | $3,302 | $15,040 |
| 2024 | $1,351 | $19,950 | $1,045 | $18,905 |
| 2023 | $1,351 | $19,950 | $1,045 | $18,905 |
| 2022 | $1,025 | $13,870 | $1,673 | $12,197 |
| 2021 | $1,024 | $13,870 | $1,673 | $12,197 |
| 2020 | $1,003 | $13,201 | $1,673 | $11,528 |
| 2019 | $987 | $13,201 | $1,673 | $11,528 |
| 2018 | $900 | $11,490 | $1,456 | $10,034 |
| 2017 | $900 | $11,490 | $1,456 | $10,034 |
| 2016 | $886 | $11,202 | $1,566 | $9,636 |
Source: Public Records
Map
Nearby Homes
- 808 S Savage St
- 801 S Crane St
- 715 S Savage St
- 914 E South Ave
- 903 S Pope Ave
- 504 S Hunter St
- 912 E Stone St
- 1040 E Stone St
- 1400 E Hayward Ave
- 930 S Leslie St
- 1215 E South Ave
- 925 S Emery St
- 913 S Hocker Ave
- 1124 S Haden St
- 816 S Woodbury St
- 904 S Pearl St
- 204 S Rogers St
- 524 E Walnut St
- 103 N Wilson St
- 1017 E Smith Ave
- 800 S Raymond St
- 915 E Hayward Ave
- 804 S Raymond St
- 803 S Crane St
- 805 S Crane St
- 808 S Raymond St
- 918 E Hayward Ave
- 807 S Crane St
- 924 E Hayward Ave
- 803 S Raymond St
- 810 S Raymond St
- 801 S Raymond St
- 807 S Raymond St
- 1000 E Hayward Ave
- 812 S Raymond St
- 809 S Raymond St
- 802 S Crane St
- 814 S Raymond St
- 1006 E Hayward Ave
- 814B S Raymond St
Your Personal Tour Guide
Ask me questions while you tour the home.