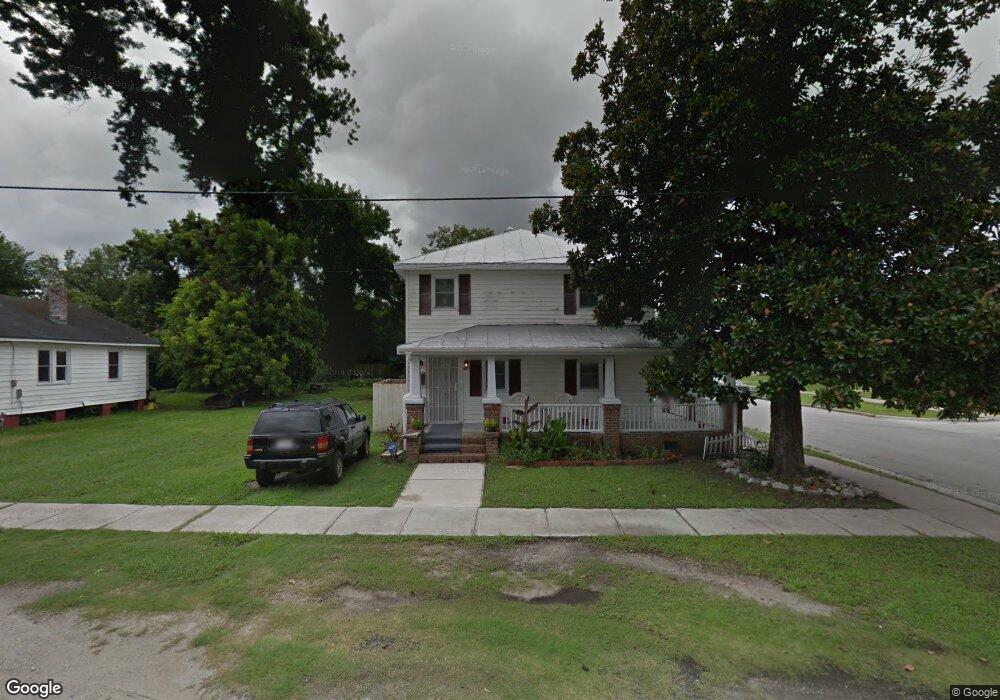
921 Elm St New Bern, NC 28560
Estimated Value: $53,000 - $159,000
3
Beds
2
Baths
672
Sq Ft
$177/Sq Ft
Est. Value
About This Home
This home is located at 921 Elm St, New Bern, NC 28560 and is currently estimated at $118,964, approximately $177 per square foot. 921 Elm St is a home located in Craven County with nearby schools including J.T. Barber Elementary School, H.J. MacDonald Middle School, and New Bern High School.
Ownership History
Date
Name
Owned For
Owner Type
Purchase Details
Closed on
Sep 10, 2017
Sold by
Henderson William F Est
Bought by
Smith James
Current Estimated Value
Purchase Details
Closed on
Jun 9, 2014
Sold by
Vandeline Smith-Henderson and Smith Smith-Henderson
Bought by
Henderson William F and Smith James
Purchase Details
Closed on
Jul 17, 2008
Sold by
White Alonzo James and White Cheryl
Bought by
Kenon Indiana White
Purchase Details
Closed on
Dec 16, 2005
Sold by
Allen Kenneth A and Allen Mary F
Bought by
Henderson Vandeline Smith and Smith James L
Create a Home Valuation Report for This Property
The Home Valuation Report is an in-depth analysis detailing your home's value as well as a comparison with similar homes in the area
Home Values in the Area
Average Home Value in this Area
Purchase History
| Date | Buyer | Sale Price | Title Company |
|---|---|---|---|
| Smith James | $25,000 | -- | |
| Henderson William F | -- | -- | |
| Kenon Indiana White | $10,000 | None Available | |
| Henderson Vandeline Smith | $11,000 | None Available |
Source: Public Records
Tax History Compared to Growth
Tax History
| Year | Tax Paid | Tax Assessment Tax Assessment Total Assessment is a certain percentage of the fair market value that is determined by local assessors to be the total taxable value of land and additions on the property. | Land | Improvement |
|---|---|---|---|---|
| 2024 | $1,070 | $119,490 | $5,400 | $114,090 |
| 2023 | $1,046 | $119,490 | $5,400 | $114,090 |
| 2022 | $844 | $75,250 | $4,000 | $71,250 |
| 2021 | $844 | $75,250 | $4,000 | $71,250 |
| 2020 | $836 | $75,250 | $4,000 | $71,250 |
| 2019 | $836 | $75,250 | $4,000 | $71,250 |
| 2018 | $788 | $75,250 | $4,000 | $71,250 |
| 2017 | $788 | $75,250 | $4,000 | $71,250 |
| 2016 | $788 | $100,780 | $3,060 | $97,720 |
| 2015 | $920 | $100,780 | $3,060 | $97,720 |
| 2014 | $920 | $100,780 | $3,060 | $97,720 |
Source: Public Records
Map
Nearby Homes