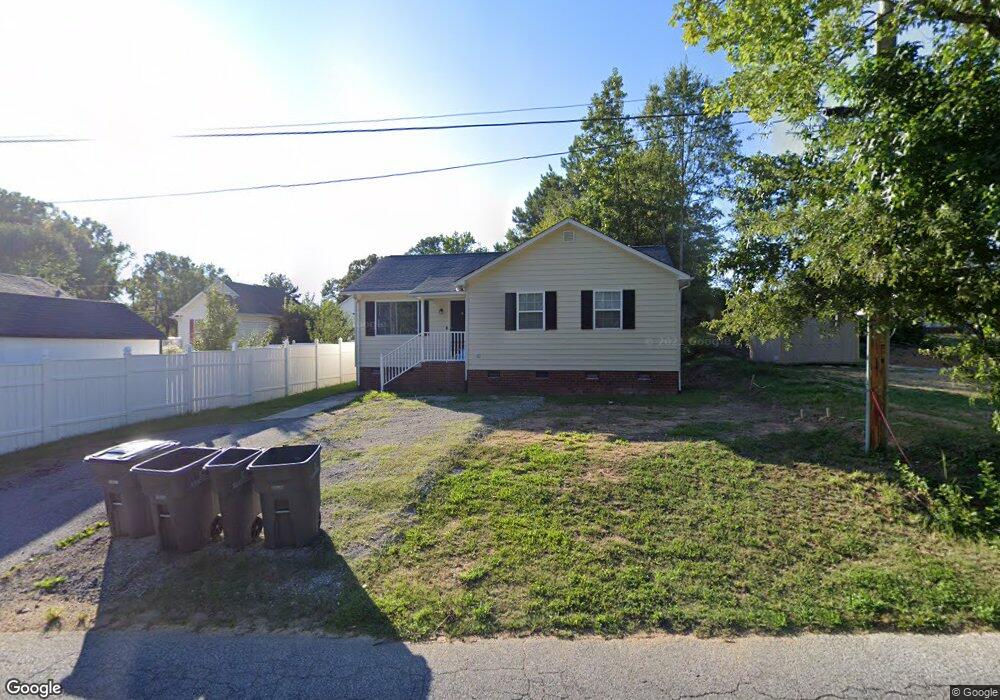
921 Fairview St Kannapolis, NC 28083
Estimated Value: $223,000 - $260,000
3
Beds
2
Baths
1,073
Sq Ft
$229/Sq Ft
Est. Value
About This Home
This home is located at 921 Fairview St, Kannapolis, NC 28083 and is currently estimated at $246,002, approximately $229 per square foot. 921 Fairview St is a home located in Cabarrus County with nearby schools including Jackson Park Elementary School, Kannapolis Middle, and A.L. Brown High School.
Ownership History
Date
Name
Owned For
Owner Type
Purchase Details
Closed on
May 13, 2021
Sold by
Wealth Cap Funds Llc
Bought by
Theaman Scott
Current Estimated Value
Home Financials for this Owner
Home Financials are based on the most recent Mortgage that was taken out on this home.
Original Mortgage
$137,625
Outstanding Balance
$124,723
Interest Rate
3.1%
Mortgage Type
New Conventional
Estimated Equity
$121,279
Purchase Details
Closed on
Mar 1, 2021
Sold by
Bell James P and Cruse Everett D
Bought by
Wealth Cap Funds Llc
Purchase Details
Closed on
Nov 2, 2010
Sold by
Roseman Harold E
Bought by
Bell James and Cruse Everett
Home Financials for this Owner
Home Financials are based on the most recent Mortgage that was taken out on this home.
Original Mortgage
$52,824
Interest Rate
4.37%
Mortgage Type
New Conventional
Purchase Details
Closed on
May 7, 1999
Sold by
Durham Howard Chester
Bought by
Roseman Harold E
Purchase Details
Closed on
Apr 1, 1999
Sold by
Kerley Broadway Otis C and Kerley Broadway Joyce
Bought by
Durham Howard Chester
Create a Home Valuation Report for This Property
The Home Valuation Report is an in-depth analysis detailing your home's value as well as a comparison with similar homes in the area
Home Values in the Area
Average Home Value in this Area
Purchase History
| Date | Buyer | Sale Price | Title Company |
|---|---|---|---|
| Theaman Scott | $183,500 | None Available | |
| Wealth Cap Funds Llc | $105,000 | None Available | |
| Bell James | $66,000 | None Available | |
| Roseman Harold E | $13,000 | -- | |
| Durham Howard Chester | -- | -- |
Source: Public Records
Mortgage History
| Date | Status | Borrower | Loan Amount |
|---|---|---|---|
| Open | Theaman Scott | $137,625 | |
| Previous Owner | Bell James | $52,824 |
Source: Public Records
Tax History Compared to Growth
Tax History
| Year | Tax Paid | Tax Assessment Tax Assessment Total Assessment is a certain percentage of the fair market value that is determined by local assessors to be the total taxable value of land and additions on the property. | Land | Improvement |
|---|---|---|---|---|
| 2025 | $2,584 | $227,550 | $50,000 | $177,550 |
| 2024 | $2,584 | $227,550 | $50,000 | $177,550 |
| 2023 | $1,773 | $129,420 | $26,000 | $103,420 |
| 2022 | $1,773 | $115,730 | $26,000 | $89,730 |
| 2021 | $1,586 | $115,730 | $26,000 | $89,730 |
| 2020 | $1,586 | $115,730 | $26,000 | $89,730 |
| 2019 | $1,021 | $74,520 | $4,500 | $70,020 |
| 2018 | $1,006 | $74,520 | $4,500 | $70,020 |
| 2017 | $991 | $74,520 | $4,500 | $70,020 |
| 2016 | $991 | $80,110 | $7,500 | $72,610 |
| 2015 | -- | $80,110 | $7,500 | $72,610 |
| 2014 | -- | $80,110 | $7,500 | $72,610 |
Source: Public Records
Map
Nearby Homes
- 1022 Lakeview St
- 1218 Martin Luther King Junior Ave
- 1422 Mitchell Glen St
- 818 Skyland St
- 132 Kennedy Ave
- 910 Fairview St
- 108 S Little Texas Rd
- 621 Norland Ave
- 1052 Mclain Rd
- 1050 Mclain Rd
- 704 Gem St Unit 17
- 704 S Harding Ave
- 803 Irene Ave
- 00 Dixie Dr
- 209 James St
- 141 Beaumont Ave
- 617 Fairview St
- 615 Fairview St
- 137 Beaumont Ave
- 608 Fairview St
- 1111 Lakeview St
- 1107 Lakeview St
- 1108 Skyland St
- 1105 Lakeview St
- 1105 Lakeview St Unit 18
- 1104 Skyland St
- 1103 Lakeview St
- 1110 Lakeview St
- 1114 Lakeview St
- 1101 Lakeview St
- 1100 Skyland St
- 1102 Skyland St
- 1106 Lakeview St
- 1107 Skyland St
- 1012 Skyland St
- 1103 Skyland St
- 1102 Lakeview St
- 1023 Lakeview St
- 1011 Lakeview St
- 1010 Skyland St