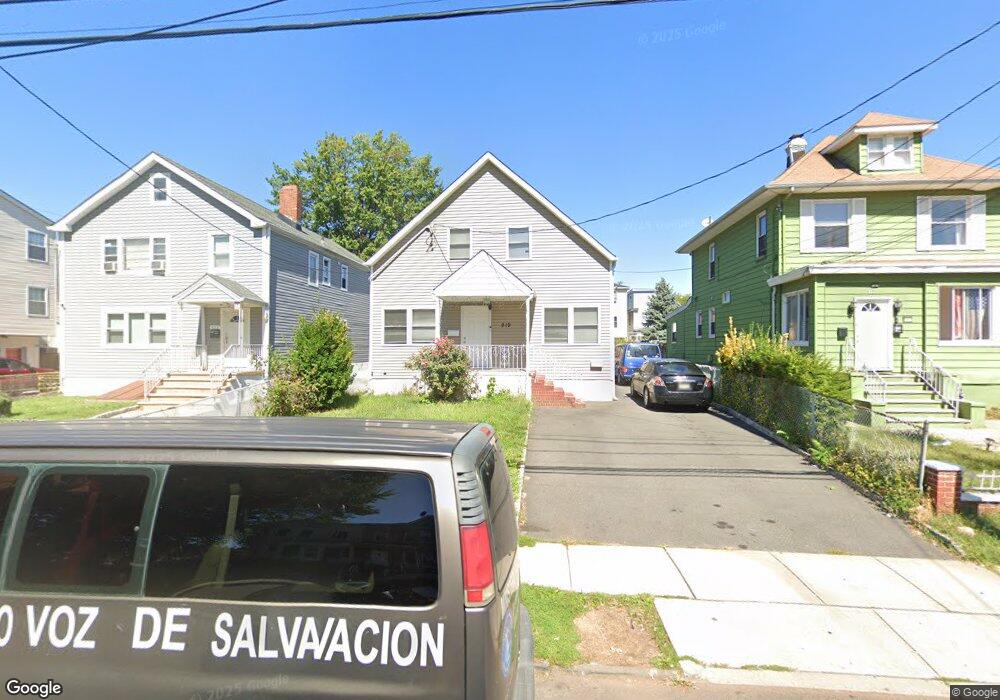
921 Grove St Unit 923 Elizabeth, NJ 07202
Bayway NeighborhoodEstimated Value: $533,000 - $791,000
--
Bed
--
Bath
2,392
Sq Ft
$291/Sq Ft
Est. Value
About This Home
This home is located at 921 Grove St Unit 923, Elizabeth, NJ 07202 and is currently estimated at $695,065, approximately $290 per square foot. 921 Grove St Unit 923 is a home located in Union County with nearby schools including Elizabeth High School, Sinai Christian Academy, and JVJ STEM Academy - School No. 92.
Ownership History
Date
Name
Owned For
Owner Type
Purchase Details
Closed on
May 20, 2010
Sold by
Quintero Gustavo and Quintero Luz Dary
Bought by
Guallpa Luis A
Current Estimated Value
Home Financials for this Owner
Home Financials are based on the most recent Mortgage that was taken out on this home.
Original Mortgage
$166,920
Outstanding Balance
$112,208
Interest Rate
5.11%
Mortgage Type
FHA
Estimated Equity
$582,857
Purchase Details
Closed on
Jul 24, 2002
Sold by
Dasilva Jose
Bought by
Quintero Gustavo and Quintero Luz
Home Financials for this Owner
Home Financials are based on the most recent Mortgage that was taken out on this home.
Original Mortgage
$259,200
Interest Rate
6.58%
Create a Home Valuation Report for This Property
The Home Valuation Report is an in-depth analysis detailing your home's value as well as a comparison with similar homes in the area
Home Values in the Area
Average Home Value in this Area
Purchase History
| Date | Buyer | Sale Price | Title Company |
|---|---|---|---|
| Guallpa Luis A | $170,000 | Chicago Title Insurance Co | |
| Quintero Gustavo | $324,000 | -- |
Source: Public Records
Mortgage History
| Date | Status | Borrower | Loan Amount |
|---|---|---|---|
| Open | Guallpa Luis A | $166,920 | |
| Previous Owner | Quintero Gustavo | $259,200 |
Source: Public Records
Tax History Compared to Growth
Tax History
| Year | Tax Paid | Tax Assessment Tax Assessment Total Assessment is a certain percentage of the fair market value that is determined by local assessors to be the total taxable value of land and additions on the property. | Land | Improvement |
|---|---|---|---|---|
| 2025 | $10,611 | $551,500 | $204,800 | $346,700 |
| 2024 | $14,772 | $551,500 | $204,800 | $346,700 |
| 2023 | $14,372 | $47,000 | $10,400 | $36,600 |
| 2022 | $14,372 | $47,000 | $10,400 | $36,600 |
| 2021 | $14,076 | $47,000 | $10,400 | $36,600 |
| 2020 | $13,757 | $47,000 | $10,400 | $36,600 |
| 2019 | $13,547 | $47,000 | $10,400 | $36,600 |
| 2018 | $14,243 | $49,900 | $10,400 | $39,500 |
| 2017 | $13,846 | $49,900 | $10,400 | $39,500 |
| 2016 | $13,847 | $49,900 | $10,400 | $39,500 |
| 2015 | $13,023 | $49,900 | $10,400 | $39,500 |
| 2014 | $14,709 | $58,100 | $10,400 | $47,700 |
Source: Public Records
Map
Nearby Homes
- 923 Mclain St
- 19 Stewart Place
- 830 Grove St
- 17 Boyle Place
- 857 Garden St
- 351 S Broad St Unit 405
- 831 Gibbons Ct
- 109 Ely St
- 842 Gibbons Ct
- 355 Rahway Ave
- 225 S Broad St Unit 1-D
- 225 S Broad St Unit 1-E
- 937 S Elmora Ave
- 859 Bayway Cir Unit 861
- 437 Maple Ave
- 1036 8 S Elmora Ave
- 715 Summer St Unit 2
- 636 Norwood Terrace
- 558 S Broad St
- 534-536 Maple Ave
- 919 Grove St Unit 921
- 919 Grove St
- 350 Rosehill Place Unit 352
- 354-356 Rosehill Place Unit 2
- 354 Rosehill Place Unit 2
- 354 Rosehill Place
- 348 Rosehill Place
- 915 Grove St Unit 917
- 346 Rosehill Place
- 915-917 Grove St
- 342-344 Rosehill Place
- 342 Rosehill Place Unit 344
- 913 Grove St Unit 915
- 400 Rosehill Place
- 924 Mclain St
- 920 Grove St
- 920 Grove St
- 920 Grove St Unit 922
- 920 Mclain St
- 928 Grove St