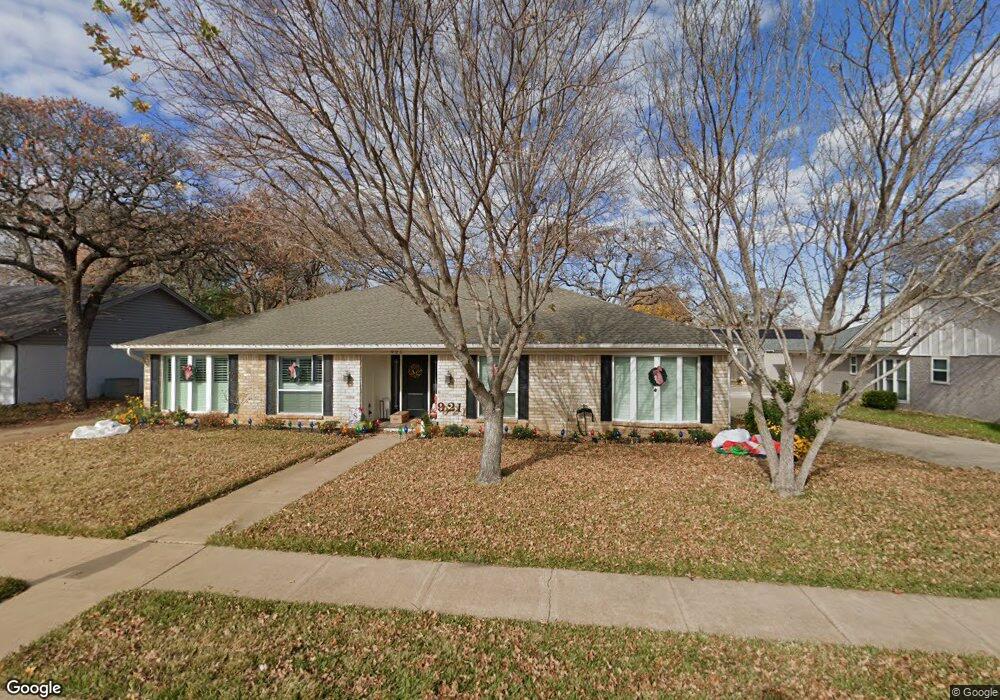
921 Harwood Terrace Bedford, TX 76021
Estimated Value: $425,825 - $526,000
4
Beds
2
Baths
2,484
Sq Ft
$187/Sq Ft
Est. Value
About This Home
This home is located at 921 Harwood Terrace, Bedford, TX 76021 and is currently estimated at $464,456, approximately $186 per square foot. 921 Harwood Terrace is a home located in Tarrant County with nearby schools including Bedford Heights Elementary School, Bedford Junior High School, and L.D. Bell High School.
Ownership History
Date
Name
Owned For
Owner Type
Purchase Details
Closed on
Nov 29, 2000
Sold by
Bradford Carl L and Bradford Janice
Bought by
Southard Clifford W
Current Estimated Value
Home Financials for this Owner
Home Financials are based on the most recent Mortgage that was taken out on this home.
Original Mortgage
$149,150
Outstanding Balance
$55,042
Interest Rate
7.72%
Estimated Equity
$409,414
Purchase Details
Closed on
Mar 19, 1996
Sold by
Hedgpeth Calmore N and Hedgpeth Patricia A
Bought by
Bradford Carl L and Bradford Janice
Home Financials for this Owner
Home Financials are based on the most recent Mortgage that was taken out on this home.
Original Mortgage
$120,000
Interest Rate
7.35%
Mortgage Type
Seller Take Back
Create a Home Valuation Report for This Property
The Home Valuation Report is an in-depth analysis detailing your home's value as well as a comparison with similar homes in the area
Home Values in the Area
Average Home Value in this Area
Purchase History
| Date | Buyer | Sale Price | Title Company |
|---|---|---|---|
| Southard Clifford W | -- | Southwest Land Title | |
| Bradford Carl L | -- | -- |
Source: Public Records
Mortgage History
| Date | Status | Borrower | Loan Amount |
|---|---|---|---|
| Open | Southard Clifford W | $149,150 | |
| Previous Owner | Bradford Carl L | $120,000 |
Source: Public Records
Tax History Compared to Growth
Tax History
| Year | Tax Paid | Tax Assessment Tax Assessment Total Assessment is a certain percentage of the fair market value that is determined by local assessors to be the total taxable value of land and additions on the property. | Land | Improvement |
|---|---|---|---|---|
| 2025 | $5,585 | $352,812 | $80,000 | $272,812 |
| 2024 | $5,585 | $352,812 | $80,000 | $272,812 |
| 2023 | $6,214 | $323,961 | $60,000 | $263,961 |
| 2022 | $6,658 | $304,854 | $60,000 | $244,854 |
| 2021 | $6,548 | $277,995 | $60,000 | $217,995 |
| 2020 | $7,186 | $302,255 | $60,000 | $242,255 |
| 2019 | $7,215 | $304,362 | $60,000 | $244,362 |
| 2018 | $6,177 | $269,978 | $60,000 | $209,978 |
| 2017 | $6,147 | $258,530 | $30,000 | $228,530 |
| 2016 | $5,588 | $231,811 | $30,000 | $201,811 |
| 2015 | $4,519 | $213,069 | $30,000 | $183,069 |
| 2014 | $4,519 | $190,900 | $20,000 | $170,900 |
Source: Public Records
Map
Nearby Homes
- 909 Brestol Ct W
- 3624 Wayne Ct
- 3609 Wayne Ct
- 1109 Simpson Terrace
- 628 Huntwich Dr
- 3605 Spring Valley Dr
- 1136 Wingate Dr
- 4002 Copperwood Ct
- 3907 Copperwood Ct
- 913 Kensington Ct
- 4105 Inwood Ln
- 1209 Hillandale Ct
- 3301 Wendover Ct
- 1303 Crest Dr
- 3213 Spring Valley Dr
- 405 Woodbriar Ct
- 3119 Spring Grove Dr
- 1421 Plantation Dr N
- 305 Warbler Dr
- 801 Shady Creek Ln
- 917 Harwood Terrace
- 925 Harwood Terrace
- 916 Brestol Ct W
- 912 Brestol Ct W
- 913 Harwood Terrace
- 920 Brestol Ct W
- 920 Brestol Ct W
- 3636 Shady Brook Dr
- 3633 Wayne Ct
- 908 Brestol Ct W
- 929 Harwood Terrace
- 909 Harwood Terrace
- 3632 Shady Brook Dr
- 3629 Wayne Ct
- 904 Brestol Ct W
- 900 Brestol Ct E
- 3645 Shady Brook Dr
- 3632 Wayne Ct
- 921 Brestol Ct W
- 933 Harwood Terrace