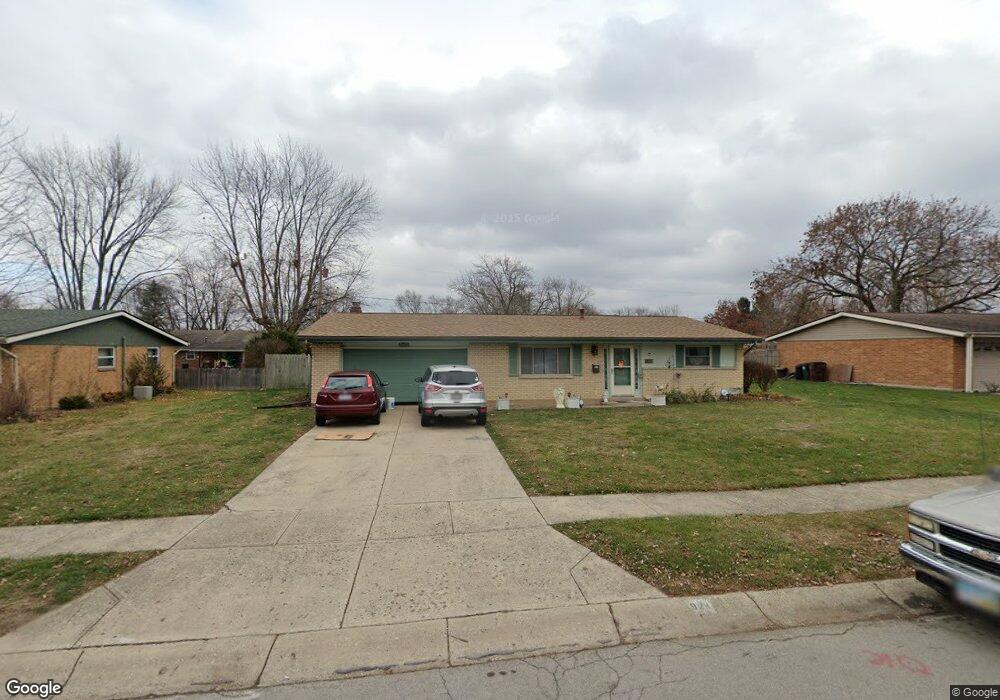
921 Hile Ln Englewood, OH 45322
Estimated Value: $188,000 - $207,742
3
Beds
2
Baths
1,400
Sq Ft
$142/Sq Ft
Est. Value
About This Home
This home is located at 921 Hile Ln, Englewood, OH 45322 and is currently estimated at $198,686, approximately $141 per square foot. 921 Hile Ln is a home located in Montgomery County with nearby schools including Northmont High School, Trotwood Preparatory & Fitness Academy, and Imagine Schools - Woodbury Academy.
Ownership History
Date
Name
Owned For
Owner Type
Purchase Details
Closed on
Jul 11, 2013
Sold by
Reidenbach James E and Reidenbach Carolyne K
Bought by
Reidenbach James E and Reidenbach Carolyn K
Current Estimated Value
Home Financials for this Owner
Home Financials are based on the most recent Mortgage that was taken out on this home.
Original Mortgage
$89,200
Outstanding Balance
$65,757
Interest Rate
4.25%
Mortgage Type
Future Advance Clause Open End Mortgage
Estimated Equity
$132,929
Purchase Details
Closed on
Jul 15, 2004
Sold by
Orihood Michael J and Orihood Julie A
Bought by
Reidenbach James E
Home Financials for this Owner
Home Financials are based on the most recent Mortgage that was taken out on this home.
Original Mortgage
$100,710
Interest Rate
5.87%
Mortgage Type
Purchase Money Mortgage
Purchase Details
Closed on
Dec 29, 1993
Sold by
Wagner Donald L and Wagner Jo A
Bought by
Orihood Michael J and Orihood Julie A
Create a Home Valuation Report for This Property
The Home Valuation Report is an in-depth analysis detailing your home's value as well as a comparison with similar homes in the area
Home Values in the Area
Average Home Value in this Area
Purchase History
| Date | Buyer | Sale Price | Title Company |
|---|---|---|---|
| Reidenbach James E | -- | None Available | |
| Reidenbach James E | $111,900 | -- | |
| Orihood Michael J | -- | Landmark Title |
Source: Public Records
Mortgage History
| Date | Status | Borrower | Loan Amount |
|---|---|---|---|
| Open | Reidenbach James E | $89,200 | |
| Closed | Reidenbach James E | $100,710 |
Source: Public Records
Tax History Compared to Growth
Tax History
| Year | Tax Paid | Tax Assessment Tax Assessment Total Assessment is a certain percentage of the fair market value that is determined by local assessors to be the total taxable value of land and additions on the property. | Land | Improvement |
|---|---|---|---|---|
| 2024 | $2,647 | $55,490 | $9,830 | $45,660 |
| 2023 | $2,647 | $55,490 | $9,830 | $45,660 |
| 2022 | $2,249 | $39,010 | $6,920 | $32,090 |
| 2021 | $2,256 | $39,010 | $6,920 | $32,090 |
| 2020 | $2,213 | $39,010 | $6,920 | $32,090 |
| 2019 | $1,863 | $31,540 | $7,960 | $23,580 |
| 2018 | $1,830 | $31,540 | $7,960 | $23,580 |
| 2017 | $1,817 | $31,540 | $7,960 | $23,580 |
| 2016 | $2,442 | $30,190 | $6,920 | $23,270 |
| 2015 | $2,233 | $30,190 | $6,920 | $23,270 |
| 2014 | $2,233 | $30,190 | $6,920 | $23,270 |
| 2012 | -- | $32,380 | $7,660 | $24,720 |
Source: Public Records
Map
Nearby Homes
- 803 Albert St
- 206 Lodestone Dr
- 104 Silverstone Dr
- 510 Rohr Ln
- 109 Silverstone Dr
- 717 Woodlawn Ave
- 607 Albert St
- 510 Lambert Ln
- 520 S Main St
- 534 Unger Ave
- 718 Bonnycastle Ave
- 108 Tate Ave
- 208 S Walnut St
- 505 Durst Dr
- 1010 Heathwood Dr
- 123 Chestnut St
- 108 Denwood Trail
- 206 Gardengrove Way
- 1017 Terracewood Dr
- 1008 Merrywood Dr