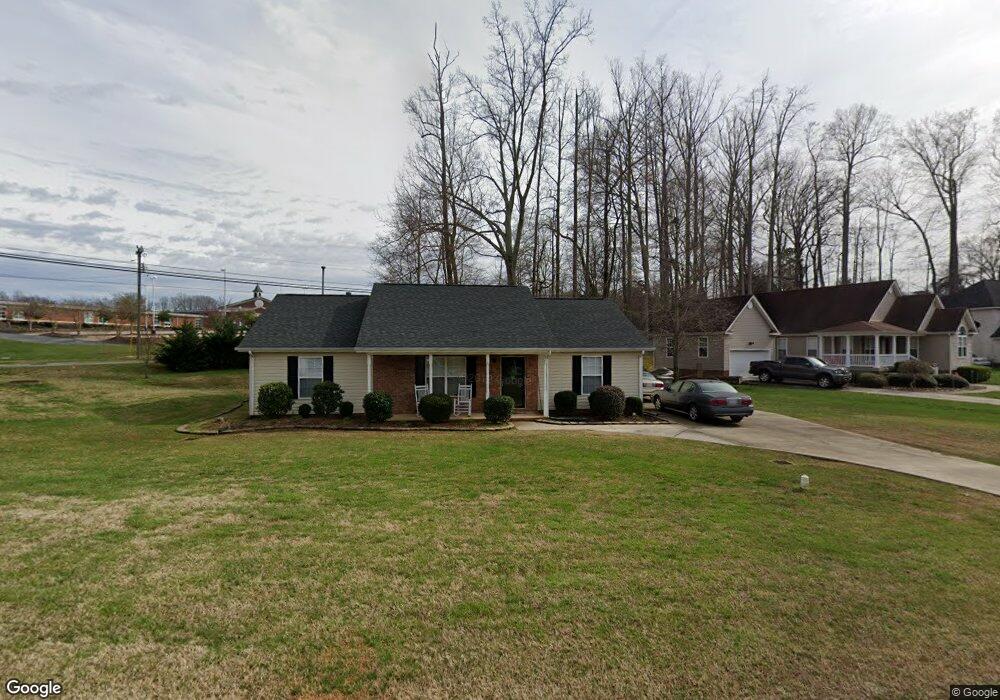
921 Lynnview Ct Kannapolis, NC 28081
Estimated Value: $294,829 - $336,000
3
Beds
2
Baths
1,513
Sq Ft
$206/Sq Ft
Est. Value
About This Home
This home is located at 921 Lynnview Ct, Kannapolis, NC 28081 and is currently estimated at $311,957, approximately $206 per square foot. 921 Lynnview Ct is a home located in Cabarrus County with nearby schools including Shady Brook Elementary School, Kannapolis Middle, and A.L. Brown High School.
Ownership History
Date
Name
Owned For
Owner Type
Purchase Details
Closed on
Oct 31, 2013
Sold by
Thompson Nancy C
Bought by
Hamilton Heather
Current Estimated Value
Home Financials for this Owner
Home Financials are based on the most recent Mortgage that was taken out on this home.
Original Mortgage
$63,500
Outstanding Balance
$47,355
Interest Rate
4.23%
Mortgage Type
New Conventional
Estimated Equity
$264,602
Purchase Details
Closed on
Aug 27, 2003
Sold by
Nova Builders Inc
Bought by
Thompson Nancy C
Home Financials for this Owner
Home Financials are based on the most recent Mortgage that was taken out on this home.
Original Mortgage
$119,000
Interest Rate
6.62%
Mortgage Type
Purchase Money Mortgage
Create a Home Valuation Report for This Property
The Home Valuation Report is an in-depth analysis detailing your home's value as well as a comparison with similar homes in the area
Home Values in the Area
Average Home Value in this Area
Purchase History
| Date | Buyer | Sale Price | Title Company |
|---|---|---|---|
| Hamilton Heather | $120,000 | None Available | |
| Thompson Nancy C | $119,000 | -- |
Source: Public Records
Mortgage History
| Date | Status | Borrower | Loan Amount |
|---|---|---|---|
| Open | Hamilton Heather | $63,500 | |
| Previous Owner | Thompson Nancy C | $119,000 |
Source: Public Records
Tax History Compared to Growth
Tax History
| Year | Tax Paid | Tax Assessment Tax Assessment Total Assessment is a certain percentage of the fair market value that is determined by local assessors to be the total taxable value of land and additions on the property. | Land | Improvement |
|---|---|---|---|---|
| 2025 | $2,920 | $257,150 | $80,000 | $177,150 |
| 2024 | $2,920 | $257,150 | $80,000 | $177,150 |
| 2023 | $2,117 | $154,530 | $43,000 | $111,530 |
| 2022 | $2,117 | $154,530 | $43,000 | $111,530 |
| 2021 | $2,117 | $154,530 | $43,000 | $111,530 |
| 2020 | $2,117 | $154,530 | $43,000 | $111,530 |
| 2019 | $1,694 | $123,640 | $24,000 | $99,640 |
| 2018 | $1,669 | $123,640 | $24,000 | $99,640 |
| 2017 | $1,644 | $123,640 | $24,000 | $99,640 |
| 2016 | $1,644 | $124,160 | $30,000 | $94,160 |
| 2015 | $1,564 | $124,160 | $30,000 | $94,160 |
| 2014 | $1,564 | $124,160 | $30,000 | $94,160 |
Source: Public Records
Map
Nearby Homes
- 1410 Oakwood Ave
- 1441 Sherwood Dr
- 1418 Oakwood Ave
- 1229 Brecken Ct
- 1408 Nottingham Rd
- 1003 Robinhood Ln
- 1620 Longbow Dr
- 1693 Azalea Ave
- 1408 Wildwood Dr
- 1828 Independence Square
- 2009 Independence Square
- 1110 Rogers Lake Rd
- 1201 Berkshire Dr
- 915 Sprucewood St
- 2609 Lamp Post Ln
- 1200 Berkshire Dr
- 00 Sapp Rd
- 1309 Red Birch Place
- 1208 Berkshire Dr
- 1656 Heather Glen Rd
- 929 Lynnview Ct
- 916 Lynnview Ct
- 908 Lynnview Ct
- 935 Lynnview Ct
- 926 Lynnview Ct
- 940 Lynnview Ct
- 941 Lynnview Ct
- 811 Woodmoore Ln
- 948 Lynnview Ct
- 815 Woodmoore Ln
- 947 Lynnview Ct
- 823 Woodmoore Ln
- 958 Lynnview Ct
- 955 Lynnview Ct
- 1462 Oakwood Ave
- 806 Woodmoore Ln
- 802 Woodmoore Ln
- 966 Lynnview Ct
- 961 Lynnview Ct
- 826 Woodmoore Ln