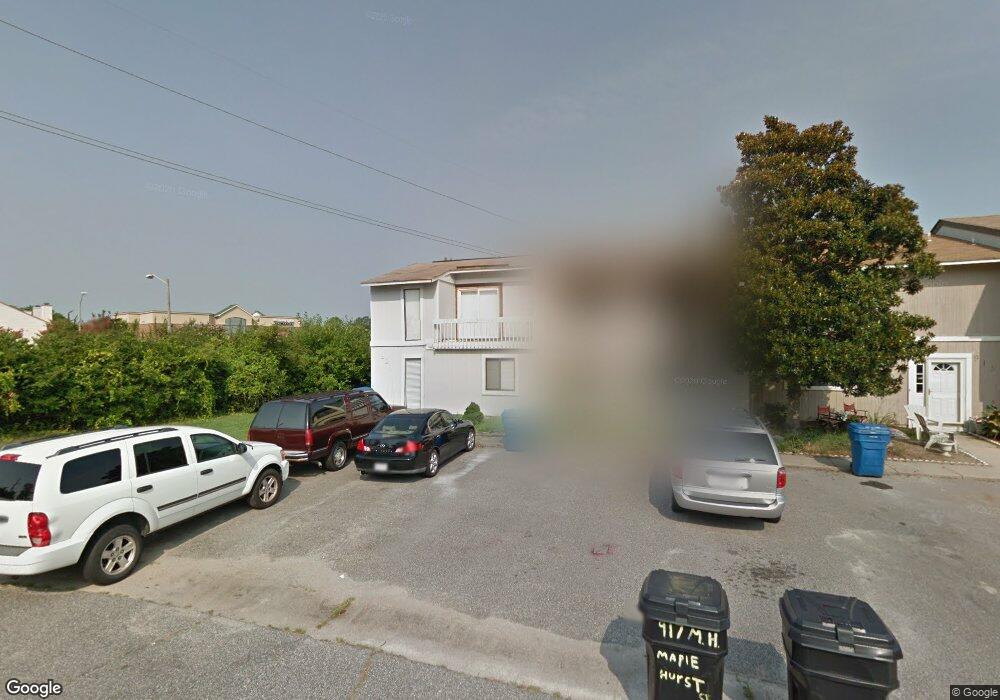
921 Maplehurst Ct Virginia Beach, VA 23462
Green Run NeighborhoodEstimated Value: $306,000 - $365,000
4
Beds
2
Baths
1,596
Sq Ft
$208/Sq Ft
Est. Value
About This Home
This home is located at 921 Maplehurst Ct, Virginia Beach, VA 23462 and is currently estimated at $332,259, approximately $208 per square foot. 921 Maplehurst Ct is a home located in Virginia Beach City with nearby schools including Kempsville Meadows Elementary School, Larkspur Middle School, and Green Run High School.
Ownership History
Date
Name
Owned For
Owner Type
Purchase Details
Closed on
Aug 19, 2022
Sold by
Colleen Pawlirzyn
Bought by
Crayton Khristian R and Bolen Skylar
Current Estimated Value
Home Financials for this Owner
Home Financials are based on the most recent Mortgage that was taken out on this home.
Original Mortgage
$81,000
Outstanding Balance
$77,258
Interest Rate
5.22%
Mortgage Type
New Conventional
Estimated Equity
$255,001
Purchase Details
Closed on
Oct 3, 2018
Sold by
Hughes Philip G
Bought by
Pawlirzyn Colleen
Home Financials for this Owner
Home Financials are based on the most recent Mortgage that was taken out on this home.
Original Mortgage
$206,496
Interest Rate
4.5%
Mortgage Type
VA
Purchase Details
Closed on
Aug 3, 2009
Sold by
Sec Of Veterans Affairs
Bought by
Hughes Philip G
Home Financials for this Owner
Home Financials are based on the most recent Mortgage that was taken out on this home.
Original Mortgage
$141,000
Interest Rate
5.17%
Mortgage Type
VA
Create a Home Valuation Report for This Property
The Home Valuation Report is an in-depth analysis detailing your home's value as well as a comparison with similar homes in the area
Home Values in the Area
Average Home Value in this Area
Purchase History
| Date | Buyer | Sale Price | Title Company |
|---|---|---|---|
| Crayton Khristian R | $282,800 | Stewart Title | |
| Pawlirzyn Colleen | $199,900 | Attorney | |
| Hughes Philip G | $141,000 | -- |
Source: Public Records
Mortgage History
| Date | Status | Borrower | Loan Amount |
|---|---|---|---|
| Open | Crayton Khristian R | $81,000 | |
| Previous Owner | Pawlirzyn Colleen | $206,496 | |
| Previous Owner | Hughes Philip G | $141,000 |
Source: Public Records
Tax History Compared to Growth
Tax History
| Year | Tax Paid | Tax Assessment Tax Assessment Total Assessment is a certain percentage of the fair market value that is determined by local assessors to be the total taxable value of land and additions on the property. | Land | Improvement |
|---|---|---|---|---|
| 2025 | $2,737 | $292,800 | $92,000 | $200,800 |
| 2024 | $2,737 | $282,200 | $92,000 | $190,200 |
| 2023 | $2,393 | $241,700 | $75,000 | $166,700 |
| 2022 | $2,104 | $212,500 | $73,200 | $139,300 |
| 2021 | $1,914 | $193,300 | $60,000 | $133,300 |
| 2020 | $1,949 | $191,500 | $60,000 | $131,500 |
| 2019 | $1,928 | $158,500 | $57,000 | $101,500 |
| 2018 | $1,589 | $158,500 | $57,000 | $101,500 |
| 2017 | $1,571 | $156,700 | $56,500 | $100,200 |
| 2016 | $1,467 | $148,200 | $53,000 | $95,200 |
| 2015 | $1,452 | $146,700 | $53,000 | $93,700 |
| 2014 | $1,221 | $137,700 | $56,400 | $81,300 |
Source: Public Records
Map
Nearby Homes
- 804 Hester Ln
- 4193 Thistle Cir
- 869 Point Way
- 847 Mission Ave
- 4412 Barkingdale Dr
- 4125 Tattershall Ct
- 4549 Leamore Square Rd Unit 219
- 3917 Sutter St
- 4081 Joshua Ct
- 824 Willberry Dr
- 937 Joshua Dr
- 936 Joshua Dr
- 4557 Totteridge Ln
- 985 Lambourne Ln
- 1004 Banyan Dr
- 4113 Smokey Lake Dr
- 713 Waters Dr
- 1118 Tall Oak Dr
- 908 Ridgeway Ct
- 710 Waters Dr
- 917 Maplehurst Ct
- 913 Maplehurst Ct
- 909 Maplehurst Ct
- 905 Maplehurst Ct
- 4113 Maplehurst Rd
- 901 Maplehurst Ct
- 4109 Maplehurst Rd
- 4105 Maplehurst Rd
- 916 Maplehurst Ct
- 912 Maplehurst Ct
- 912 Maplehurst Ct Unit 912
- 4101 Maplehurst Rd
- 908 Maplehurst Ct
- 904 Maplehurst Ct
- 801 Christa Ct
- 900 Maplehurst Ct
- 4116 Maplehurst Rd
- 4120 Maplehurst Rd
- 803 Christa Ct
- 865 Brittlebank Dr