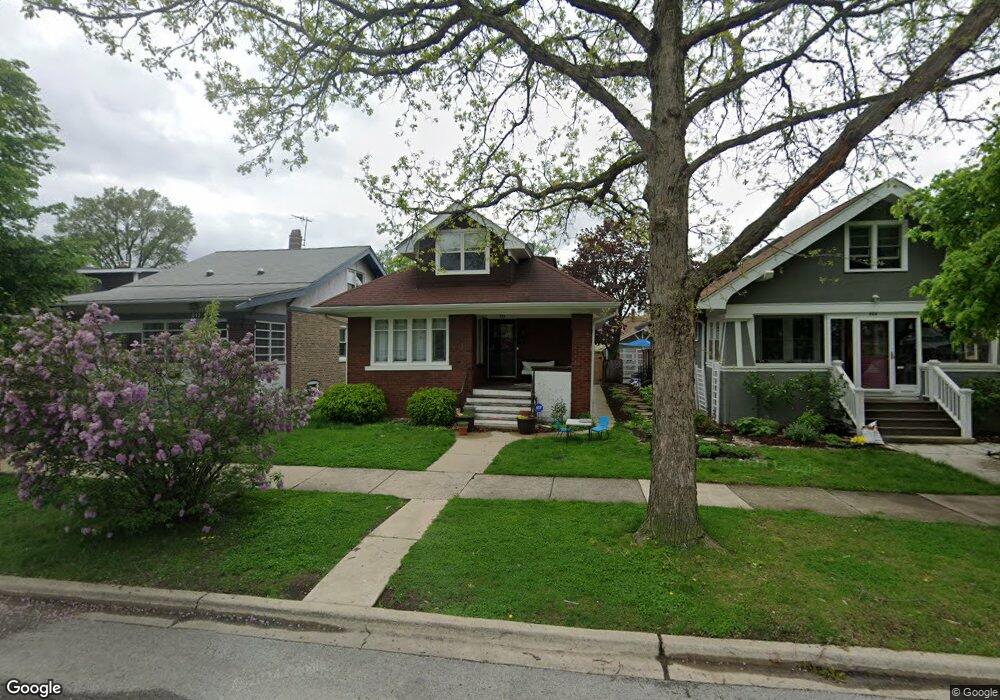
921 Mapleton Ave Oak Park, IL 60302
Estimated Value: $457,000 - $636,000
6
Beds
3
Baths
1,861
Sq Ft
$289/Sq Ft
Est. Value
About This Home
This home is located at 921 Mapleton Ave, Oak Park, IL 60302 and is currently estimated at $537,067, approximately $288 per square foot. 921 Mapleton Ave is a home located in Cook County with nearby schools including William Hatch Elementary School, Gwendolyn Brooks Middle School, and Oak Park and River Forest High School.
Ownership History
Date
Name
Owned For
Owner Type
Purchase Details
Closed on
Oct 17, 2017
Sold by
Haftel Zeev Yoram and Haftel Einat
Bought by
Rock David J and Rock Supriya S
Current Estimated Value
Home Financials for this Owner
Home Financials are based on the most recent Mortgage that was taken out on this home.
Original Mortgage
$335,750
Outstanding Balance
$278,798
Interest Rate
3.87%
Mortgage Type
New Conventional
Estimated Equity
$258,269
Purchase Details
Closed on
Sep 25, 2006
Sold by
Chicago Title Land Trust Co
Bought by
Haftel Yoram and Haftel Einat
Home Financials for this Owner
Home Financials are based on the most recent Mortgage that was taken out on this home.
Original Mortgage
$205,000
Interest Rate
6.45%
Mortgage Type
Unknown
Create a Home Valuation Report for This Property
The Home Valuation Report is an in-depth analysis detailing your home's value as well as a comparison with similar homes in the area
Home Values in the Area
Average Home Value in this Area
Purchase History
| Date | Buyer | Sale Price | Title Company |
|---|---|---|---|
| Rock David J | $395,000 | Chicago Title | |
| Haftel Yoram | $455,000 | Burnet Title |
Source: Public Records
Mortgage History
| Date | Status | Borrower | Loan Amount |
|---|---|---|---|
| Open | Rock David J | $335,750 | |
| Previous Owner | Haftel Yoram | $205,000 |
Source: Public Records
Tax History
| Year | Tax Paid | Tax Assessment Tax Assessment Total Assessment is a certain percentage of the fair market value that is determined by local assessors to be the total taxable value of land and additions on the property. | Land | Improvement |
|---|---|---|---|---|
| 2025 | $11,887 | $39,780 | $6,040 | $33,740 |
| 2024 | $11,887 | $39,780 | $6,040 | $33,740 |
| 2023 | $13,818 | $39,780 | $6,040 | $33,740 |
| 2022 | $13,818 | $39,406 | $5,227 | $34,179 |
| 2021 | $13,499 | $39,405 | $5,226 | $34,179 |
| 2020 | $13,252 | $39,405 | $5,226 | $34,179 |
| 2019 | $11,685 | $33,886 | $4,762 | $29,124 |
| 2018 | $15,259 | $41,321 | $4,762 | $36,559 |
| 2017 | $13,705 | $41,321 | $4,762 | $36,559 |
| 2016 | $11,922 | $32,118 | $3,949 | $28,169 |
| 2015 | $10,636 | $32,118 | $3,949 | $28,169 |
| 2014 | $9,902 | $32,118 | $3,949 | $28,169 |
| 2013 | $7,727 | $26,374 | $3,949 | $22,425 |
Source: Public Records
Map
Nearby Homes
- 841 N Lombard Ave
- 944 N Ridgeland Ave
- 828 N Ridgeland Ave
- 805 N Cuyler Ave
- 930 N Taylor Ave
- 1038 Hayes Ave
- 921 N Humphrey Ave
- 222 Le Moyne Pkwy
- 1116 N Elmwood Ave
- 730 N Humphrey Ave
- 847 Fair Oaks Ave
- 1217 N Mason Ave
- 1047 Fair Oaks Ave
- 542 N Ridgeland Ave
- 1429 N Mason Ave
- 914 N Austin Blvd Unit A5
- 1310 N Monitor Ave
- 512 N Ridgeland Ave
- 511 N Taylor Ave
- 306 Chicago Ave Unit 3N
- 925 Mapleton Ave
- 917 Mapleton Ave
- 915 Mapleton Ave
- 929 Mapleton Ave
- 911 Mapleton Ave
- 920 N Harvey Ave
- 916 N Harvey Ave
- 922 N Harvey Ave
- 931 Mapleton Ave
- 907 Mapleton Ave
- 924 N Harvey Ave
- 914 N Harvey Ave
- 910 N Harvey Ave
- 935 Mapleton Ave
- 905 Mapleton Ave
- 928 N Harvey Ave
- 918 Mapleton Ave
- 922 Mapleton Ave
- 916 Mapleton Ave
Your Personal Tour Guide
Ask me questions while you tour the home.