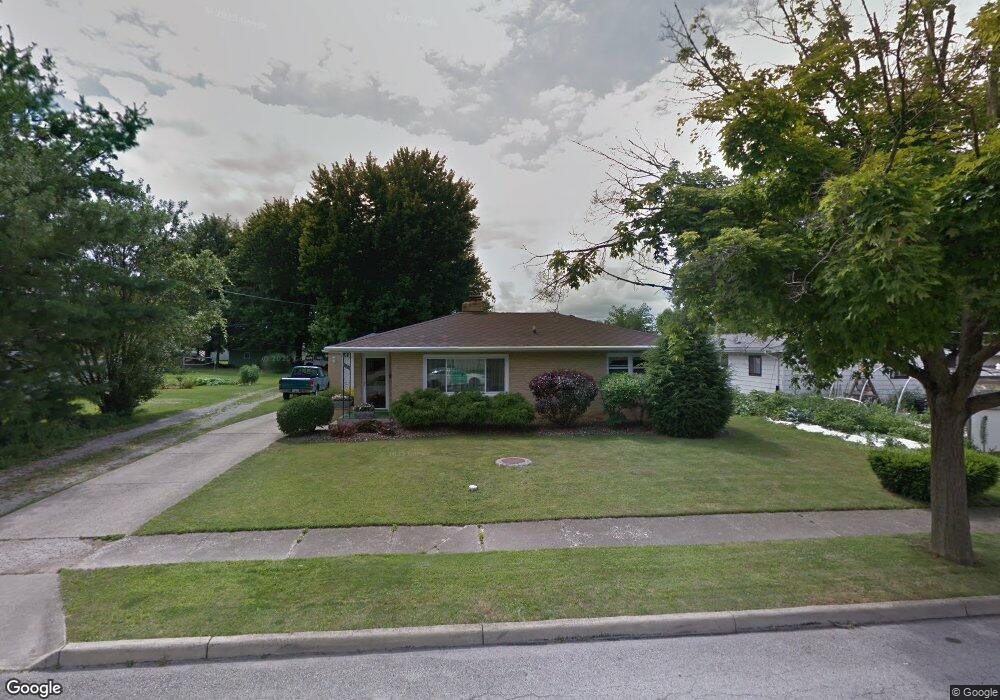
921 Monnett St Bucyrus, OH 44820
Estimated Value: $116,000 - $145,178
3
Beds
1
Bath
1,065
Sq Ft
$121/Sq Ft
Est. Value
About This Home
This home is located at 921 Monnett St, Bucyrus, OH 44820 and is currently estimated at $129,295, approximately $121 per square foot. 921 Monnett St is a home located in Crawford County with nearby schools including Bucyrus Elementary School, Bucyrus Secondary School, and Holy Trinity School.
Ownership History
Date
Name
Owned For
Owner Type
Purchase Details
Closed on
Dec 30, 2021
Sold by
Furry Bernard A and Furry Karen J
Bought by
Dejean Cortney Lee
Current Estimated Value
Home Financials for this Owner
Home Financials are based on the most recent Mortgage that was taken out on this home.
Original Mortgage
$102,600
Outstanding Balance
$94,378
Interest Rate
3.12%
Mortgage Type
New Conventional
Estimated Equity
$34,917
Create a Home Valuation Report for This Property
The Home Valuation Report is an in-depth analysis detailing your home's value as well as a comparison with similar homes in the area
Home Values in the Area
Average Home Value in this Area
Purchase History
| Date | Buyer | Sale Price | Title Company |
|---|---|---|---|
| Dejean Cortney Lee | -- | None Listed On Document |
Source: Public Records
Mortgage History
| Date | Status | Borrower | Loan Amount |
|---|---|---|---|
| Open | Dejean Cortney Lee | $102,600 |
Source: Public Records
Tax History Compared to Growth
Tax History
| Year | Tax Paid | Tax Assessment Tax Assessment Total Assessment is a certain percentage of the fair market value that is determined by local assessors to be the total taxable value of land and additions on the property. | Land | Improvement |
|---|---|---|---|---|
| 2024 | $1,679 | $37,230 | $3,680 | $33,550 |
| 2023 | $1,679 | $24,450 | $3,680 | $20,770 |
| 2022 | $816 | $24,450 | $3,680 | $20,770 |
| 2021 | $814 | $24,450 | $3,680 | $20,770 |
| 2020 | $859 | $24,450 | $3,680 | $20,770 |
| 2019 | $878 | $24,450 | $3,680 | $20,770 |
| 2018 | $874 | $24,450 | $3,680 | $20,770 |
| 2017 | $784 | $22,350 | $3,680 | $18,670 |
| 2016 | $760 | $22,350 | $3,680 | $18,670 |
| 2015 | $749 | $22,350 | $3,680 | $18,670 |
| 2014 | $746 | $22,350 | $3,680 | $18,670 |
| 2013 | $746 | $22,350 | $3,680 | $18,670 |
Source: Public Records
Map
Nearby Homes
- 1221 N Sandusky Ave
- 1018 Tiffin St
- 511 Plymouth St
- 1575 N Sandusky Ave
- 517 Plymouth St
- 450 Sears St
- 711 Plymouth St
- 303 W Galen St
- 124 N Spring St
- 407 E Mansfield St
- 412 E Rensselaer St
- 316 W Warren St
- 317 S Spring St
- 508 W Charles St
- 444 Woodlawn Ave
- 531 S Poplar St
- 319 Sheckler St
- 550 S Walnut St
- 325 W Liberty St
- 346 Hopley Ave
- 205 Franklin Ct
- 211 Franklin Ct
- 211 Franklin Ct
- 215 Franklin Ct
- 920 Monnett St
- 200 Bland Ave
- 212 Bland Ave
- 916 Monnett St
- 916 Monnett St
- 216 Bland Ave
- 939 Monnett St
- 149 Franklin St
- 141 Franklin St
- 223 Franklin Ct
- 138 Bland Ave
- 943 Monnett St
- 220 Bland Ave
- 210 Franklin Ct
- 229 Franklin Ct
- 226 Bland Ave