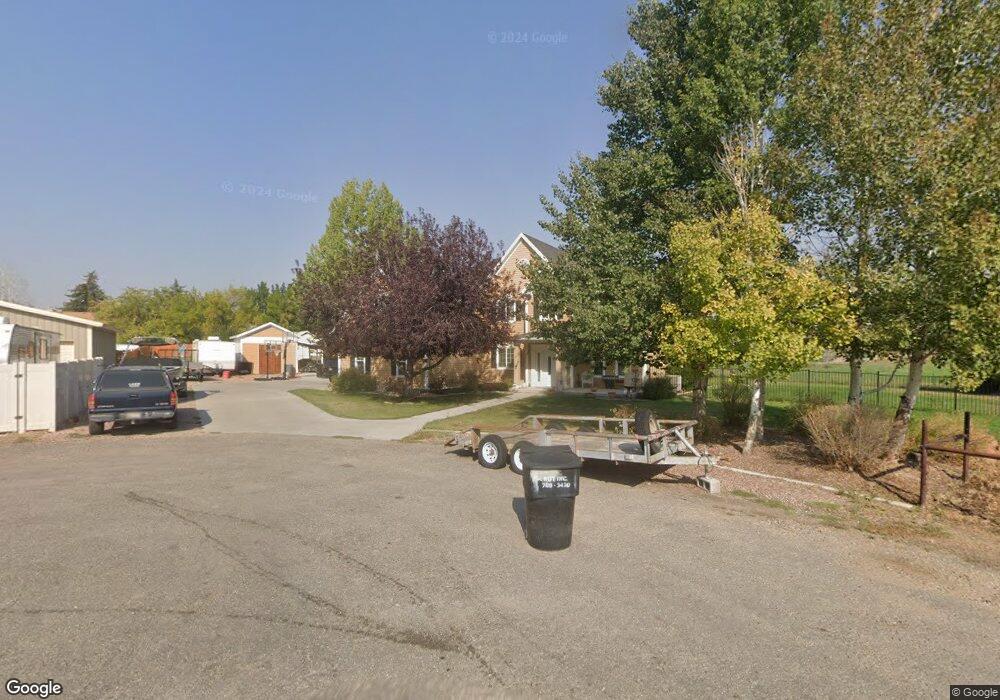
921 N 2000 W Vernal, UT 84078
Estimated Value: $646,607
6
Beds
5
Baths
3,576
Sq Ft
$181/Sq Ft
Est. Value
About This Home
This home is located at 921 N 2000 W, Vernal, UT 84078 and is currently estimated at $646,607, approximately $180 per square foot. 921 N 2000 W is a home located in Uintah County with nearby schools including Maeser School, Uintah Middle School, and Vernal Middle School.
Ownership History
Date
Name
Owned For
Owner Type
Purchase Details
Closed on
Apr 22, 2021
Sold by
Mansfield Brian and Masfield Jennifer
Bought by
Mckenna Ktle N and Mckenna Rhohonda
Current Estimated Value
Home Financials for this Owner
Home Financials are based on the most recent Mortgage that was taken out on this home.
Original Mortgage
$400,000
Outstanding Balance
$361,728
Interest Rate
3.1%
Mortgage Type
Stand Alone Refi Refinance Of Original Loan
Estimated Equity
$284,879
Purchase Details
Closed on
Jun 11, 2009
Sold by
Jewett Gary D and Jewett Lora L
Bought by
Corporation Of The Presiding Bishop Of T
Purchase Details
Closed on
Jul 11, 2005
Sold by
Jolley Lisa H
Bought by
Jewett Gary D and Jewett Lora L
Home Financials for this Owner
Home Financials are based on the most recent Mortgage that was taken out on this home.
Original Mortgage
$220,000
Interest Rate
5.51%
Mortgage Type
Construction
Create a Home Valuation Report for This Property
The Home Valuation Report is an in-depth analysis detailing your home's value as well as a comparison with similar homes in the area
Home Values in the Area
Average Home Value in this Area
Purchase History
| Date | Buyer | Sale Price | Title Company |
|---|---|---|---|
| Mckenna Ktle N | -- | None Available | |
| Corporation Of The Presiding Bishop Of T | -- | -- | |
| Jewett Gary D | -- | -- |
Source: Public Records
Mortgage History
| Date | Status | Borrower | Loan Amount |
|---|---|---|---|
| Open | Mckenna Ktle N | $400,000 | |
| Previous Owner | Jewett Gary D | $220,000 |
Source: Public Records
Tax History Compared to Growth
Tax History
| Year | Tax Paid | Tax Assessment Tax Assessment Total Assessment is a certain percentage of the fair market value that is determined by local assessors to be the total taxable value of land and additions on the property. | Land | Improvement |
|---|---|---|---|---|
| 2024 | $2,412 | $287,029 | $28,596 | $258,433 |
| 2023 | $2,374 | $267,158 | $28,596 | $238,562 |
| 2022 | $2,264 | $219,369 | $24,750 | $194,619 |
| 2021 | $2,249 | $178,951 | $22,000 | $156,951 |
| 2020 | $2,191 | $178,951 | $22,000 | $156,951 |
| 2019 | $2,217 | $178,951 | $22,000 | $156,951 |
| 2018 | $2,122 | $171,477 | $22,000 | $149,477 |
| 2017 | $20 | $162,498 | $22,000 | $140,498 |
| 2016 | $1,880 | $166,843 | $22,000 | $144,843 |
| 2015 | $1,738 | $167,494 | $22,000 | $145,494 |
| 2014 | $1,718 | $167,494 | $22,000 | $145,494 |
Source: Public Records
Map
Nearby Homes
- 1620 W 750 N
- 1917 W 1500 N
- 2215 W 1500 N
- 521 N 2400 W
- 526 N 1380 W Unit 6
- 2690 W 500 N
- 1647 N 1500 W
- 2396 W 1500 N
- 242 N 1200 W
- 1350 W 150 N Unit 21
- 1350 W 150 N Unit 22
- 50 S 1500 W Unit 20
- 50 S 1500 W Unit 113
- 50 S 1500 W Unit 29
- 50 S 1500 W Unit 105
- 50 S 1500 W Unit 8
- 50 S 1500 W Unit 17
- 2993 W 1500 N
- 2120 N 2500 W
- 1601 W 300 S Unit 57