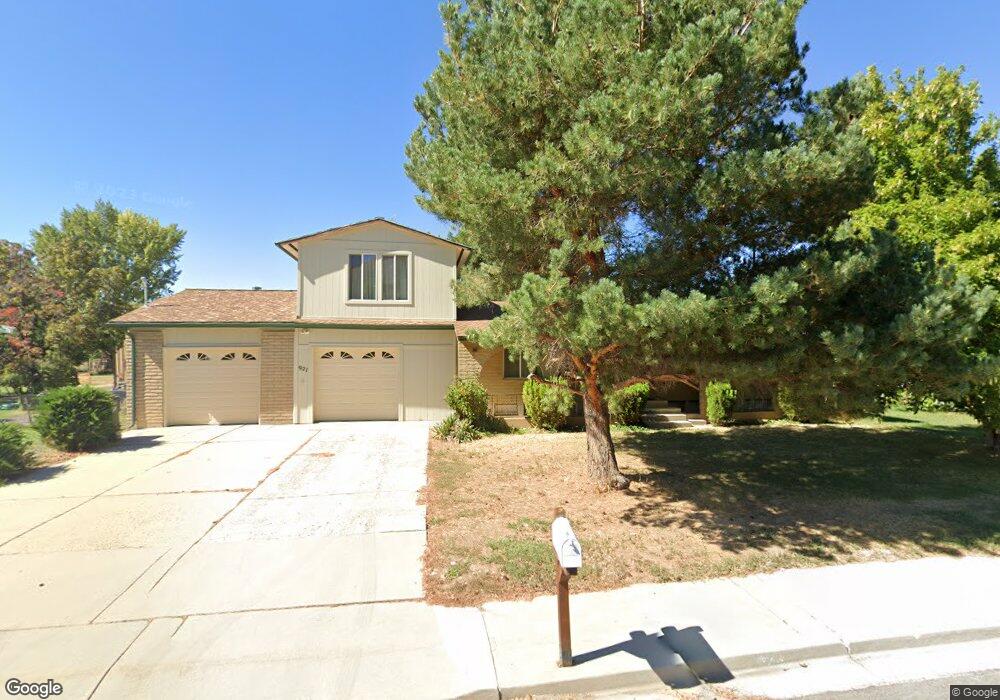
921 N 700 E Mapleton, UT 84664
Estimated Value: $567,000 - $830,996
5
Beds
2
Baths
3,030
Sq Ft
$234/Sq Ft
Est. Value
About This Home
This home is located at 921 N 700 E, Mapleton, UT 84664 and is currently estimated at $709,999, approximately $234 per square foot. 921 N 700 E is a home located in Utah County with nearby schools including Hobble Creek School, Mapleton Junior High School, and Maple Mountain High School.
Ownership History
Date
Name
Owned For
Owner Type
Purchase Details
Closed on
Aug 12, 2025
Sold by
Douglas M Harlan Trust and Harlan David T
Bought by
Harrison Justin and Harrison Keri
Current Estimated Value
Purchase Details
Closed on
Oct 10, 2018
Sold by
Harlan Douglas M
Bought by
Harlan Douglas M and Douglas M Harlan Trust
Purchase Details
Closed on
May 10, 2002
Sold by
Bank One National Assn
Bought by
Harlan Douglas M
Home Financials for this Owner
Home Financials are based on the most recent Mortgage that was taken out on this home.
Original Mortgage
$108,800
Interest Rate
7.13%
Mortgage Type
Balloon
Purchase Details
Closed on
Oct 9, 1998
Sold by
Workman Wayne
Bought by
Thompson Richard G and Thompson Patty K
Create a Home Valuation Report for This Property
The Home Valuation Report is an in-depth analysis detailing your home's value as well as a comparison with similar homes in the area
Home Values in the Area
Average Home Value in this Area
Purchase History
| Date | Buyer | Sale Price | Title Company |
|---|---|---|---|
| Harrison Justin | -- | Inwest Title | |
| Harlan Douglas M | -- | None Available | |
| Harlan Douglas M | -- | Metro National Title | |
| Thompson Richard G | -- | -- |
Source: Public Records
Mortgage History
| Date | Status | Borrower | Loan Amount |
|---|---|---|---|
| Previous Owner | Harlan Douglas M | $108,800 |
Source: Public Records
Tax History
| Year | Tax Paid | Tax Assessment Tax Assessment Total Assessment is a certain percentage of the fair market value that is determined by local assessors to be the total taxable value of land and additions on the property. | Land | Improvement |
|---|---|---|---|---|
| 2025 | $2,995 | $322,025 | -- | -- |
| 2024 | $2,995 | $293,370 | $0 | $0 |
| 2023 | $3,018 | $297,495 | $0 | $0 |
| 2022 | $3,077 | $299,970 | $0 | $0 |
| 2021 | $2,490 | $372,600 | $203,100 | $169,500 |
| 2020 | $2,412 | $349,200 | $179,700 | $169,500 |
| 2019 | $2,164 | $319,800 | $172,400 | $147,400 |
| 2018 | $1,079 | $268,000 | $145,200 | $122,800 |
| 2017 | $1,057 | $137,720 | $0 | $0 |
| 2016 | $952 | $124,575 | $0 | $0 |
| 2015 | $834 | $109,945 | $0 | $0 |
| 2014 | $775 | $101,200 | $0 | $0 |
Source: Public Records
Map
Nearby Homes
- 594 E 1000 N
- 775 N 800 E
- 435 E 1000 N
- 1096 N 1000 E
- 265 E 600 N
- 1567 N 600 E Unit 26
- 310 N 800 E
- 84 E 530 N
- 897 N Main St
- 1350 N Main St
- 141 N 600 E
- 162 N 800 E
- 1447 N 1350 St E Unit 5
- 1577 N 1350 St E Unit 1
- 1477 N 1350 St E Unit 4
- 1547 N 1350 St E Unit 2
- 1511 N 1350 St E Unit 3
- 1548 N 1350 St E Unit 11
- 1578 N 1350 St E Unit 12
- 745 E Maple St
Your Personal Tour Guide
Ask me questions while you tour the home.