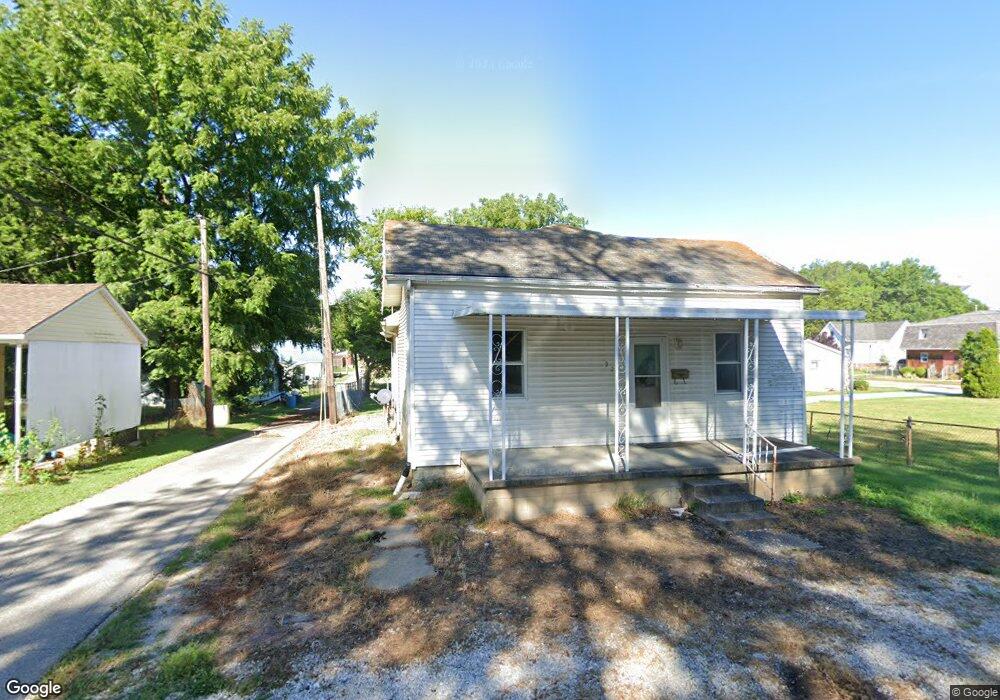
921 N Canal St Mount Vernon, IN 47620
Estimated Value: $98,000 - $119,381
2
Beds
1
Bath
1,124
Sq Ft
$96/Sq Ft
Est. Value
About This Home
This home is located at 921 N Canal St, Mount Vernon, IN 47620 and is currently estimated at $108,095, approximately $96 per square foot. 921 N Canal St is a home located in Posey County with nearby schools including Mount Vernon Junior High School, Mount Vernon High School, and St. Matthew Elementary School.
Ownership History
Date
Name
Owned For
Owner Type
Purchase Details
Closed on
May 29, 2025
Sold by
Walnut Street Plaza Llc
Bought by
Davis Laird D and Davis Catherine C
Current Estimated Value
Purchase Details
Closed on
Apr 6, 2010
Sold by
Angermeier Philip and Angermeier Philip L
Bought by
Walnut Street Plaza Llc
Purchase Details
Closed on
Nov 30, 2009
Sold by
The Bank Of New York Mellon
Bought by
Angermeier Philip
Purchase Details
Closed on
Nov 13, 2008
Sold by
James E Folz
Bought by
The Bank Of New York
Purchase Details
Closed on
Dec 13, 2005
Sold by
Chapman Judith L and Oneil Judith L
Bought by
Angermeier Walter
Home Financials for this Owner
Home Financials are based on the most recent Mortgage that was taken out on this home.
Original Mortgage
$7,900
Interest Rate
6.36%
Mortgage Type
Second Mortgage Made To Cover Down Payment
Create a Home Valuation Report for This Property
The Home Valuation Report is an in-depth analysis detailing your home's value as well as a comparison with similar homes in the area
Home Values in the Area
Average Home Value in this Area
Purchase History
| Date | Buyer | Sale Price | Title Company |
|---|---|---|---|
| Davis Laird D | -- | First American Title | |
| Walnut Street Plaza Llc | -- | None Available | |
| Angermeier Philip | -- | None Available | |
| The Bank Of New York | $27,000 | -- | |
| Cit Group | $26,954 | None Available | |
| Angermeier Walter | -- | Progressive Land Title |
Source: Public Records
Mortgage History
| Date | Status | Borrower | Loan Amount |
|---|---|---|---|
| Previous Owner | Angermeier Walter | $7,900 | |
| Previous Owner | Angermeier Walter | $63,200 |
Source: Public Records
Tax History Compared to Growth
Tax History
| Year | Tax Paid | Tax Assessment Tax Assessment Total Assessment is a certain percentage of the fair market value that is determined by local assessors to be the total taxable value of land and additions on the property. | Land | Improvement |
|---|---|---|---|---|
| 2024 | $1,010 | $50,500 | $8,000 | $42,500 |
| 2023 | $830 | $41,500 | $8,000 | $33,500 |
| 2022 | $782 | $39,100 | $8,000 | $31,100 |
| 2021 | $714 | $35,700 | $8,000 | $27,700 |
| 2020 | $666 | $33,300 | $7,800 | $25,500 |
| 2019 | $640 | $32,000 | $7,800 | $24,200 |
| 2018 | $624 | $31,200 | $7,800 | $23,400 |
| 2017 | $614 | $30,700 | $7,800 | $22,900 |
| 2016 | $614 | $30,700 | $7,800 | $22,900 |
| 2014 | $660 | $33,000 | $7,800 | $25,200 |
| 2013 | $660 | $33,100 | $9,000 | $24,100 |
Source: Public Records
Map
Nearby Homes
- 601 N Canal St
- 427 E 5th St
- 531 E 5th St
- 1240 Mulberry St
- 1305 Locust St
- 10800 Hwy 69 & Along Ohio River Rd
- 1230 Dereham Dr
- 317 E Lincoln Ave
- 305 Brown St
- 816 E Lincoln Ave
- 718 Davis Dr
- 1300 Harriett St
- 311 W Grant St
- 507 E Water St
- 407 W 4th St
- 1112 E 4th St
- 230 Vine St
- 521 W 2nd St
- 1235 E 3rd St
- 1212 E 2nd St