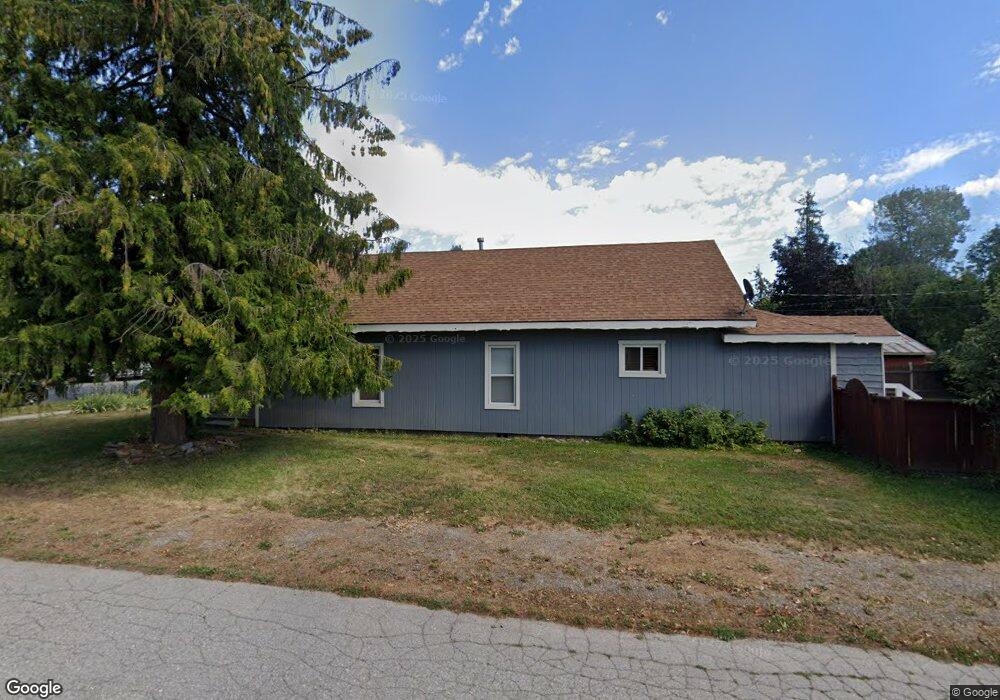
921 Oak St Sandpoint, ID 83864
Estimated Value: $413,000 - $452,000
3
Beds
1
Bath
1,150
Sq Ft
$376/Sq Ft
Est. Value
About This Home
This home is located at 921 Oak St, Sandpoint, ID 83864 and is currently estimated at $431,870, approximately $375 per square foot. 921 Oak St is a home located in Bonner County with nearby schools including Farmin Stidwell Elementary School, Sandpoint Middle School, and Sandpoint High School.
Ownership History
Date
Name
Owned For
Owner Type
Purchase Details
Closed on
Apr 20, 2017
Sold by
Horner Jerry A and Horner Kim
Bought by
Lund Paula Amy
Current Estimated Value
Purchase Details
Closed on
Mar 16, 2005
Sold by
Johnson Charles E and Johnson Barbro K
Bought by
Horner Jerry A and Horner Kim
Home Financials for this Owner
Home Financials are based on the most recent Mortgage that was taken out on this home.
Original Mortgage
$131,600
Interest Rate
5.61%
Mortgage Type
New Conventional
Create a Home Valuation Report for This Property
The Home Valuation Report is an in-depth analysis detailing your home's value as well as a comparison with similar homes in the area
Home Values in the Area
Average Home Value in this Area
Purchase History
| Date | Buyer | Sale Price | Title Company |
|---|---|---|---|
| Lund Paula Amy | $110,500 | None Available | |
| Horner Jerry A | -- | None Available |
Source: Public Records
Mortgage History
| Date | Status | Borrower | Loan Amount |
|---|---|---|---|
| Previous Owner | Horner Jerry A | $131,600 |
Source: Public Records
Tax History
| Year | Tax Paid | Tax Assessment Tax Assessment Total Assessment is a certain percentage of the fair market value that is determined by local assessors to be the total taxable value of land and additions on the property. | Land | Improvement |
|---|---|---|---|---|
| 2025 | $2,501 | $370,416 | $230,796 | $139,620 |
| 2024 | $2,537 | $380,526 | $230,796 | $149,730 |
| 2023 | $2,468 | $355,307 | $213,346 | $141,961 |
| 2022 | $2,605 | $344,543 | $187,346 | $157,197 |
| 2021 | $2,898 | $259,287 | $147,102 | $112,185 |
| 2020 | $2,197 | $196,475 | $83,570 | $112,905 |
| 2019 | $2,164 | $185,334 | $83,570 | $101,764 |
| 2018 | $2,161 | $171,316 | $73,267 | $98,049 |
| 2017 | $2,161 | $163,240 | $0 | $0 |
| 2016 | $2,370 | $129,124 | $0 | $0 |
| 2015 | $1,746 | $123,798 | $0 | $0 |
| 2014 | $886 | $119,504 | $0 | $0 |
Source: Public Records
Map
Nearby Homes
- 215 N Forest Ave
- 724 Pine St
- 706 Main St
- 1215 Church St
- 522 N Boyer Ave
- Lot 1 Fir St
- Lot 2 Fir St
- 503 Cedar St
- 503 Cedar St Unit 203
- 711 N Florence Ave
- 316 S Lavina Ave
- 1721 Larch St
- 727 N Sixth Ave
- 417 Pine St
- 727 N Sixth St
- 523 N Division Ave
- 918 N Ella Ave
- 1607 Gondola Ct
- 436 S Lavina Ave
- 1619 Gondola Ct
Your Personal Tour Guide
Ask me questions while you tour the home.