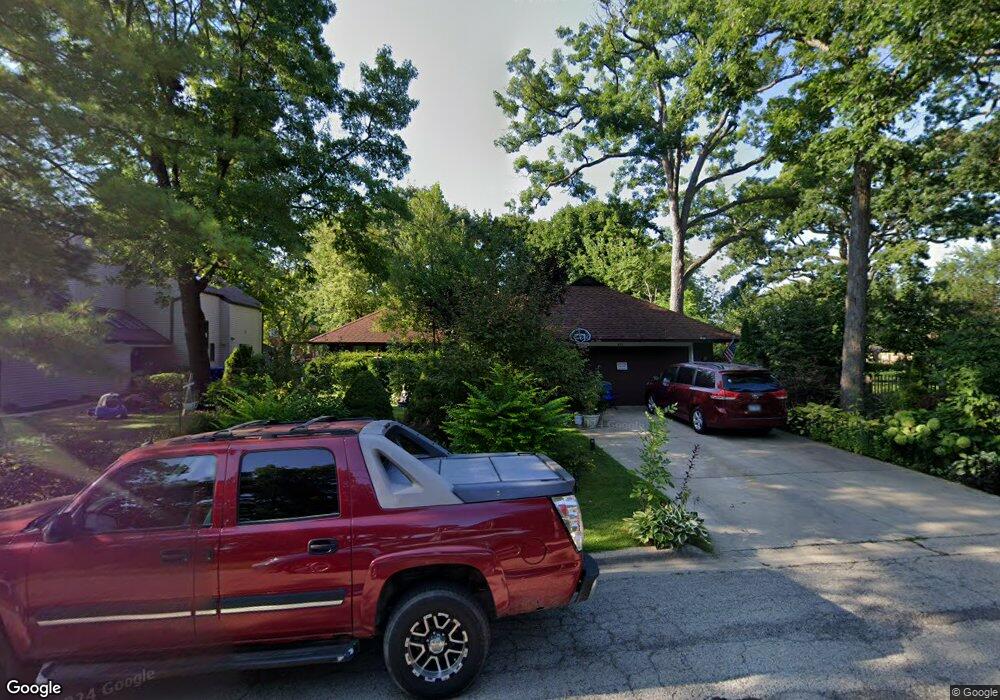
921 Oak Tree Ln Waukegan, IL 60085
Lyon Grove NeighborhoodEstimated Value: $262,000 - $321,000
3
Beds
2
Baths
1,906
Sq Ft
$157/Sq Ft
Est. Value
About This Home
This home is located at 921 Oak Tree Ln, Waukegan, IL 60085 and is currently estimated at $298,843, approximately $156 per square foot. 921 Oak Tree Ln is a home located in Lake County with nearby schools including H R McCall Elementary School, Miguel Juarez Middle School, and Waukegan High School.
Ownership History
Date
Name
Owned For
Owner Type
Purchase Details
Closed on
Jun 11, 2010
Sold by
Figueroa Jose Antonio
Bought by
Figueroa Awilda Antonia and Figueroa Jose Antonio
Current Estimated Value
Purchase Details
Closed on
Oct 22, 2003
Sold by
Minogue James Michael
Bought by
Figueroa Jose Antonio
Home Financials for this Owner
Home Financials are based on the most recent Mortgage that was taken out on this home.
Original Mortgage
$162,001
Outstanding Balance
$75,703
Interest Rate
6.23%
Mortgage Type
VA
Estimated Equity
$223,140
Purchase Details
Closed on
Jun 19, 1995
Sold by
Carravetta Vince
Bought by
Minogue James Michael
Home Financials for this Owner
Home Financials are based on the most recent Mortgage that was taken out on this home.
Original Mortgage
$124,000
Interest Rate
7.88%
Purchase Details
Closed on
Jun 7, 1995
Sold by
Yellen Morris A and Yellen Dorothy Ann
Bought by
Carravetta Vince
Home Financials for this Owner
Home Financials are based on the most recent Mortgage that was taken out on this home.
Original Mortgage
$124,000
Interest Rate
7.88%
Create a Home Valuation Report for This Property
The Home Valuation Report is an in-depth analysis detailing your home's value as well as a comparison with similar homes in the area
Home Values in the Area
Average Home Value in this Area
Purchase History
| Date | Buyer | Sale Price | Title Company |
|---|---|---|---|
| Figueroa Awilda Antonia | -- | None Available | |
| Figueroa Jose Antonio | $180,000 | -- | |
| Minogue James Michael | $155,000 | -- | |
| Carravetta Vince | $155,000 | -- |
Source: Public Records
Mortgage History
| Date | Status | Borrower | Loan Amount |
|---|---|---|---|
| Open | Figueroa Jose Antonio | $162,001 | |
| Previous Owner | Minogue James Michael | $124,000 |
Source: Public Records
Tax History Compared to Growth
Tax History
| Year | Tax Paid | Tax Assessment Tax Assessment Total Assessment is a certain percentage of the fair market value that is determined by local assessors to be the total taxable value of land and additions on the property. | Land | Improvement |
|---|---|---|---|---|
| 2024 | $6,756 | $100,004 | $14,745 | $85,259 |
| 2023 | $7,143 | $87,649 | $12,953 | $74,696 |
| 2022 | $7,143 | $79,064 | $11,847 | $67,217 |
| 2021 | $6,747 | $70,716 | $10,569 | $60,147 |
| 2020 | $6,788 | $65,880 | $9,846 | $56,034 |
| 2019 | $6,779 | $60,368 | $9,022 | $51,346 |
| 2018 | $4,896 | $44,246 | $10,216 | $34,030 |
| 2017 | $4,715 | $39,145 | $9,038 | $30,107 |
| 2016 | $4,329 | $34,016 | $7,854 | $26,162 |
| 2015 | $4,129 | $30,444 | $7,029 | $23,415 |
| 2014 | $4,465 | $31,931 | $7,223 | $24,708 |
| 2012 | $5,754 | $34,595 | $7,826 | $26,769 |
Source: Public Records
Map
Nearby Homes
- 23 N Jackson St
- 28 N Saint James St
- 428 N Poplar St
- 511 Chestnut St
- 613 Washington St
- 1416 Hamilton Ct
- 522 N Poplar St
- 452 North Ave
- 702 Franklin St
- 557 W Water St
- 620 N Poplar St
- 610 Bluff St
- 215 S Park Ave
- 222 Grand Ave
- 1521 Catalpa Ave
- 304 Powell Ave
- 613 Clarke Ave
- 305 Besley Place
- 325 4th St
- 1109 Massena Ave
- 915 Oak Tree Ln
- 1001 Oak Crest St
- 909 Oak Tree Ln
- 1005 Oak Crest St
- 914 W Clayton St
- 912 W Clayton St
- 301 Oak Crest St
- 916 W Clayton St
- 1006 W Clayton St
- 1009 Oak Crest St
- 908 W Clayton St
- 1008 W Clayton St
- 310 Oak Tree Ln
- 307 Oak Crest St
- 302 Oak Crest St
- 301 Oak Tree Ln
- 1010 W Clayton St
- 306 Oak Crest St
- 313 Oak Crest St
- 906 W Clayton St