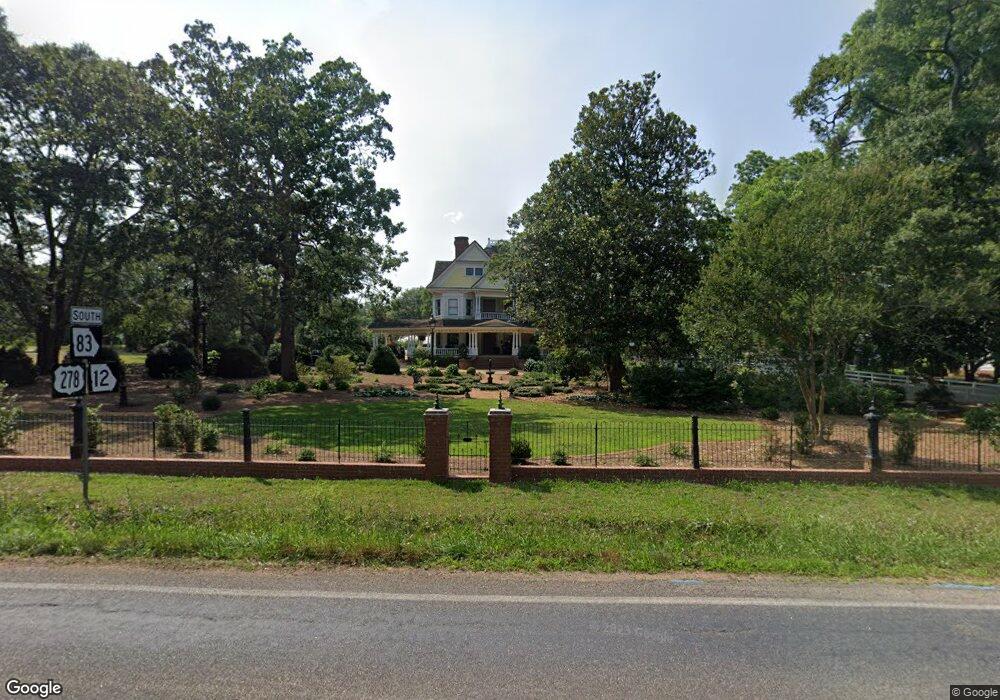
921 S Main St Madison, GA 30650
Estimated Value: $1,065,585
--
Bed
4
Baths
5,752
Sq Ft
$185/Sq Ft
Est. Value
About This Home
This home is located at 921 S Main St, Madison, GA 30650 and is currently estimated at $1,065,585, approximately $185 per square foot. 921 S Main St is a home located in Morgan County with nearby schools including Morgan County Primary School, Morgan County Elementary School, and Morgan County Middle School.
Ownership History
Date
Name
Owned For
Owner Type
Purchase Details
Closed on
Aug 12, 2022
Sold by
Jansson Solveig
Bought by
Belman Daniel B and Korando Randall E
Current Estimated Value
Purchase Details
Closed on
Apr 11, 2006
Sold by
Harden Donald B
Bought by
Harden Donald B and Harden Solveig J
Purchase Details
Closed on
Jul 10, 2003
Sold by
Harden Solveig J
Bought by
Harden Solveig J
Purchase Details
Closed on
Jun 2, 2003
Sold by
Harden Solveig J
Bought by
Harden Solveig J
Purchase Details
Closed on
Jun 20, 2001
Sold by
Harden Donald B
Bought by
Harden Solveig J
Purchase Details
Closed on
Dec 2, 1999
Sold by
Consolidated Asset
Bought by
Lybrand Karen
Purchase Details
Closed on
Jul 1, 1996
Sold by
Monahan Timothy P
Bought by
Consolidated Asset
Purchase Details
Closed on
Aug 23, 1984
Sold by
Morris O H
Bought by
Monahan Timothy P
Create a Home Valuation Report for This Property
The Home Valuation Report is an in-depth analysis detailing your home's value as well as a comparison with similar homes in the area
Home Values in the Area
Average Home Value in this Area
Purchase History
| Date | Buyer | Sale Price | Title Company |
|---|---|---|---|
| Belman Daniel B | $950,000 | -- | |
| Harden Donald B | -- | -- | |
| Harden Solveig J | -- | -- | |
| Harden Solveig J | -- | -- | |
| Harden Solveig J | -- | -- | |
| Harden Donald B | $795,000 | -- | |
| Lybrand Karen | $2,000 | -- | |
| Consolidated Asset | $550,000 | -- | |
| Monahan Timothy P | $135,000 | -- |
Source: Public Records
Tax History Compared to Growth
Tax History
| Year | Tax Paid | Tax Assessment Tax Assessment Total Assessment is a certain percentage of the fair market value that is determined by local assessors to be the total taxable value of land and additions on the property. | Land | Improvement |
|---|---|---|---|---|
| 2024 | $12,411 | $441,655 | $70,000 | $371,655 |
| 2023 | $10,754 | $383,423 | $70,000 | $313,423 |
| 2022 | $10,111 | $338,484 | $64,000 | $274,484 |
| 2021 | $10,144 | $338,238 | $64,000 | $274,238 |
| 2020 | $10,243 | $338,223 | $64,000 | $274,223 |
| 2019 | $10,405 | $338,223 | $64,000 | $274,223 |
| 2018 | $10,510 | $337,040 | $64,000 | $273,040 |
| 2017 | $10,437 | $328,046 | $64,000 | $264,046 |
| 2016 | $10,207 | $314,852 | $64,000 | $250,852 |
| 2015 | $9,343 | $284,532 | $64,000 | $220,532 |
| 2014 | $8,160 | $255,072 | $94,000 | $161,072 |
| 2013 | -- | $255,880 | $79,880 | $176,000 |
Source: Public Records
Map
Nearby Homes
- 991 Old Post Rd
- 691 Skyline Dr
- 1113 Cornwall Dr
- 617 Dixie Ave
- 665 E Walton St
- 855 Jasper St
- 991 Crawford St
- 1033 Crawford St
- 546 Fourth St
- 724 Hill St
- 411 Old Post Rd
- 0 Apalachee Ridge Unit 23542402
- 0 Apalachee Ridge Unit 23270055
- 1190 Dixie Hwy
- .78 +/- acres Poplar St
- 1000 Jacob Prickett Ln
- 1291 Spinnaker Rd
- 1001 Alaina Ave
- 1041 Alaina Ave Unit 69
- 1001 Alaina Ave Unit 71
- 877 S Main St
- 942 Old Post Rd
- 00 Eatonton Rd
- 845 Walker Cir
- 895 Old Post Rd
- 817 Old Post Rd
- 812 Old Post Rd
- 945 Old Post Rd Unit 13 BLK B
- 928 Eatonton Rd
- 928 Eatonton Rd
- 809 Old Post Rd
- 967 Old Post Rd
- 860 S Main St
- 808 Old Post Rd
- 829 S Main St
- 805 Old Post Rd
- 808 S Main St
- 826 S Main St
- 791 Old Post Rd
- 1015 Eatonton Rd