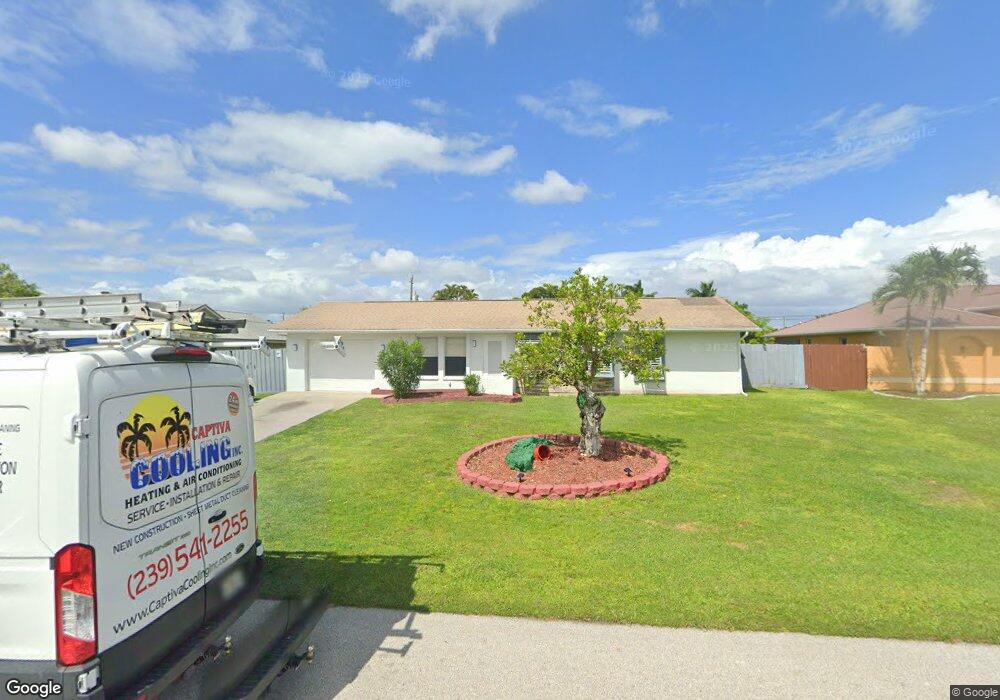
921 SE 26th St Cape Coral, FL 33904
Caloosahatchee NeighborhoodEstimated Value: $261,000 - $307,000
3
Beds
2
Baths
2,096
Sq Ft
$134/Sq Ft
Est. Value
About This Home
This home is located at 921 SE 26th St, Cape Coral, FL 33904 and is currently estimated at $280,016, approximately $133 per square foot. 921 SE 26th St is a home located in Lee County with nearby schools including Cape Elementary School, Caloosa Elementary School, and Tropic Isles Elementary School.
Ownership History
Date
Name
Owned For
Owner Type
Purchase Details
Closed on
Sep 24, 2024
Sold by
Lippy Patrick E and Lippy Diana Maria
Bought by
Lippy Patrick E and Lippy Diana Maria
Current Estimated Value
Purchase Details
Closed on
Oct 23, 2009
Sold by
Mewshaw Ann
Bought by
Lippy Patrick E
Home Financials for this Owner
Home Financials are based on the most recent Mortgage that was taken out on this home.
Original Mortgage
$79,415
Interest Rate
5.03%
Mortgage Type
FHA
Purchase Details
Closed on
Feb 3, 1997
Sold by
Veterans Affairs
Bought by
Mewshaw Joseph and Mewshaw Ann
Home Financials for this Owner
Home Financials are based on the most recent Mortgage that was taken out on this home.
Original Mortgage
$65,350
Interest Rate
7.88%
Mortgage Type
VA
Purchase Details
Closed on
Mar 31, 1995
Sold by
Sommer Christian and Sommer Mary Anne
Bought by
Payne David B and Payne Christina
Home Financials for this Owner
Home Financials are based on the most recent Mortgage that was taken out on this home.
Original Mortgage
$67,320
Interest Rate
8.7%
Mortgage Type
VA
Create a Home Valuation Report for This Property
The Home Valuation Report is an in-depth analysis detailing your home's value as well as a comparison with similar homes in the area
Home Values in the Area
Average Home Value in this Area
Purchase History
| Date | Buyer | Sale Price | Title Company |
|---|---|---|---|
| Lippy Patrick E | $100 | None Listed On Document | |
| Lippy Patrick E | $82,200 | Fidelity Natl Title Ins Co | |
| Mewshaw Joseph | $68,200 | -- | |
| Payne David B | $66,000 | -- |
Source: Public Records
Mortgage History
| Date | Status | Borrower | Loan Amount |
|---|---|---|---|
| Previous Owner | Lippy Patrick E | $79,415 | |
| Previous Owner | Mewshaw Joseph | $65,350 | |
| Previous Owner | Payne David B | $67,320 |
Source: Public Records
Tax History Compared to Growth
Tax History
| Year | Tax Paid | Tax Assessment Tax Assessment Total Assessment is a certain percentage of the fair market value that is determined by local assessors to be the total taxable value of land and additions on the property. | Land | Improvement |
|---|---|---|---|---|
| 2025 | $1,488 | $82,959 | -- | -- |
| 2024 | $1,488 | $80,621 | -- | -- |
| 2023 | $1,364 | $78,273 | $0 | $0 |
| 2022 | $1,198 | $75,993 | $0 | $0 |
| 2021 | $1,140 | $160,890 | $32,141 | $128,749 |
| 2020 | $1,136 | $72,761 | $0 | $0 |
| 2019 | $1,105 | $71,125 | $0 | $0 |
| 2018 | $1,092 | $69,799 | $0 | $0 |
| 2017 | $1,070 | $68,363 | $0 | $0 |
| 2016 | $1,045 | $109,684 | $20,461 | $89,223 |
| 2015 | $1,025 | $98,001 | $16,623 | $81,378 |
| 2014 | $1,061 | $91,005 | $14,913 | $76,092 |
| 2013 | -- | $80,104 | $10,949 | $69,155 |
Source: Public Records
Map
Nearby Homes
- 1008 SE 25th Terrace
- 1015 SE 25th Ln
- 2419 Country Club Blvd
- 2532 Shelby Pkwy
- 2540 Shelby Pkwy
- 2807 Country Club Blvd
- 2501 Academy Blvd
- 2416 SE 8th Ave
- 2728 SE 8th Ave
- 2717 Shelby Pkwy
- 2326 SE 8th Ave
- 1207 SE 27th Terrace
- 2210 SE 11th Ave
- 1219 SE 25th Terrace
- 1227 Everest Pkwy
- 624 SE 23rd Terrace
- 1216 SE 27th St
- 1110 SE 23rd St
- 1220 SE 27th St
- 610 W Archer Pkwy
- 925 SE 26th St
- 917 SE 26th St
- 922 SE 25th Ln
- 926 SE 25th Ln
- 918 SE 25th Ln
- 929 SE 26th St
- 924 SE 26th St
- 913 SE 26th St
- 920 SE 26th St
- 930 SE 25th Ln
- 930 SE 26th St
- 933 SE 26th St
- 914 SE 26th St
- 934 SE 25th Ln
- 910 SE 25th Ln
- 910 SE 26th St
- 921 SE 25th Ln
- 925 SE 26th Terrace
- 919 SE 26th Terrace
- 917 SE 25th Ln