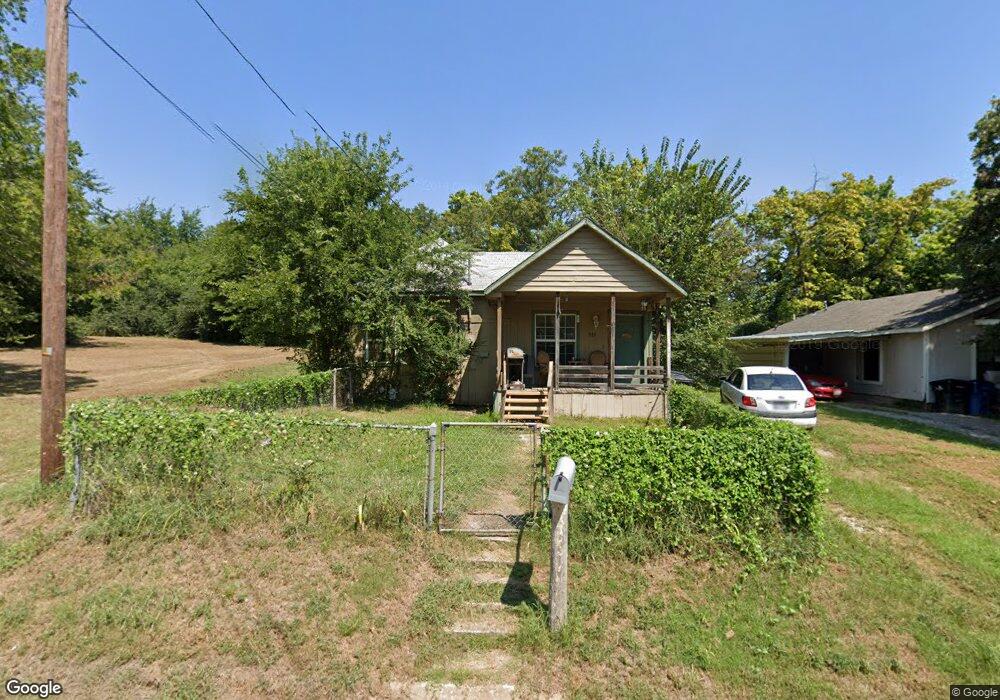
921 W Florence St Denison, TX 75020
Estimated Value: $164,695 - $238,000
3
Beds
2
Baths
1,526
Sq Ft
$132/Sq Ft
Est. Value
About This Home
This home is located at 921 W Florence St, Denison, TX 75020 and is currently estimated at $201,348, approximately $131 per square foot. 921 W Florence St is a home located in Grayson County with nearby schools including Scott Middle School, Denison High School, and St. Luke's Parish Day School.
Ownership History
Date
Name
Owned For
Owner Type
Purchase Details
Closed on
May 29, 2025
Sold by
Investor Lending Llc
Bought by
Property Remedies Inc
Current Estimated Value
Purchase Details
Closed on
Dec 3, 2024
Sold by
Pattillo Andy
Bought by
Investor Lending Llc
Purchase Details
Closed on
Sep 23, 2022
Sold by
Compton Doyle
Bought by
Jd Minyard Investments Llc
Home Financials for this Owner
Home Financials are based on the most recent Mortgage that was taken out on this home.
Original Mortgage
$171,000
Interest Rate
5.22%
Mortgage Type
Construction
Purchase Details
Closed on
Feb 23, 2005
Sold by
Compton Mary
Bought by
Compton Doyle
Home Financials for this Owner
Home Financials are based on the most recent Mortgage that was taken out on this home.
Original Mortgage
$94,500
Interest Rate
4.55%
Mortgage Type
FHA
Purchase Details
Closed on
Jan 24, 2005
Sold by
Compton Mary
Bought by
Compton Doyle
Home Financials for this Owner
Home Financials are based on the most recent Mortgage that was taken out on this home.
Original Mortgage
$94,500
Interest Rate
4.55%
Mortgage Type
FHA
Create a Home Valuation Report for This Property
The Home Valuation Report is an in-depth analysis detailing your home's value as well as a comparison with similar homes in the area
Home Values in the Area
Average Home Value in this Area
Purchase History
| Date | Buyer | Sale Price | Title Company |
|---|---|---|---|
| Property Remedies Inc | -- | None Listed On Document | |
| Investor Lending Llc | $130,000 | None Listed On Document | |
| Jd Minyard Investments Llc | -- | -- | |
| Compton Doyle | -- | -- | |
| Compton Doyle | -- | -- |
Source: Public Records
Mortgage History
| Date | Status | Borrower | Loan Amount |
|---|---|---|---|
| Previous Owner | Jd Minyard Investments Llc | $171,000 | |
| Previous Owner | Compton Doyle | $94,500 |
Source: Public Records
Tax History Compared to Growth
Tax History
| Year | Tax Paid | Tax Assessment Tax Assessment Total Assessment is a certain percentage of the fair market value that is determined by local assessors to be the total taxable value of land and additions on the property. | Land | Improvement |
|---|---|---|---|---|
| 2025 | $2,572 | $167,115 | $39,715 | $127,400 |
| 2024 | $2,572 | $110,708 | $36,660 | $74,048 |
| 2023 | $2,371 | $104,667 | $34,970 | $69,697 |
| 2022 | $1,439 | $60,552 | $0 | $0 |
| 2021 | $1,388 | $66,735 | $13,000 | $53,735 |
| 2020 | $1,320 | $66,488 | $9,750 | $56,738 |
| 2019 | $1,252 | $67,536 | $9,750 | $57,786 |
| 2018 | $1,147 | $65,639 | $5,850 | $59,789 |
| 2017 | $1,052 | $57,850 | $3,250 | $54,600 |
| 2016 | $956 | $51,973 | $3,250 | $48,723 |
| 2015 | $0 | $39,310 | $3,250 | $36,060 |
| 2014 | -- | $37,685 | $1,625 | $36,060 |
Source: Public Records
Map
Nearby Homes
- 930 W Florence St
- 904 W Florence St
- 1044 W Ford St
- 928 W Chase St
- 919 W Collins St
- 923 W Collins St
- 921 W Collins St
- 916 W Collins St
- 1901 Woodlawn Blvd
- 616 & 618 Rice St
- 614 Rice St
- 736 W Bullock St
- 1023 W Bullock St
- 603 W Star St
- 614 W Collins St
- 1210 W Bullock St
- 1016 W Hanna St
- 505 W Ford St
- 513 W Coffin St
- 701 W Star St
- 919 W Florence St
- 927 W Florence St
- 907 W Florence St
- 920 W Ford St
- 922 W Ford St
- 914 W Ford St
- 924 W Ford St
- 918 W Ford St
- 916 W Florence St
- 905 W Florence St
- 908 W Florence St
- 912 W Ford St
- 926 W Ford St
- 924 W Florence St
- 941 W Florence St
- 906 W Florence St
- 903 W Florence St
- 944 W Ford St
- 902 W Florence St
- 2203 S Scullin Ave