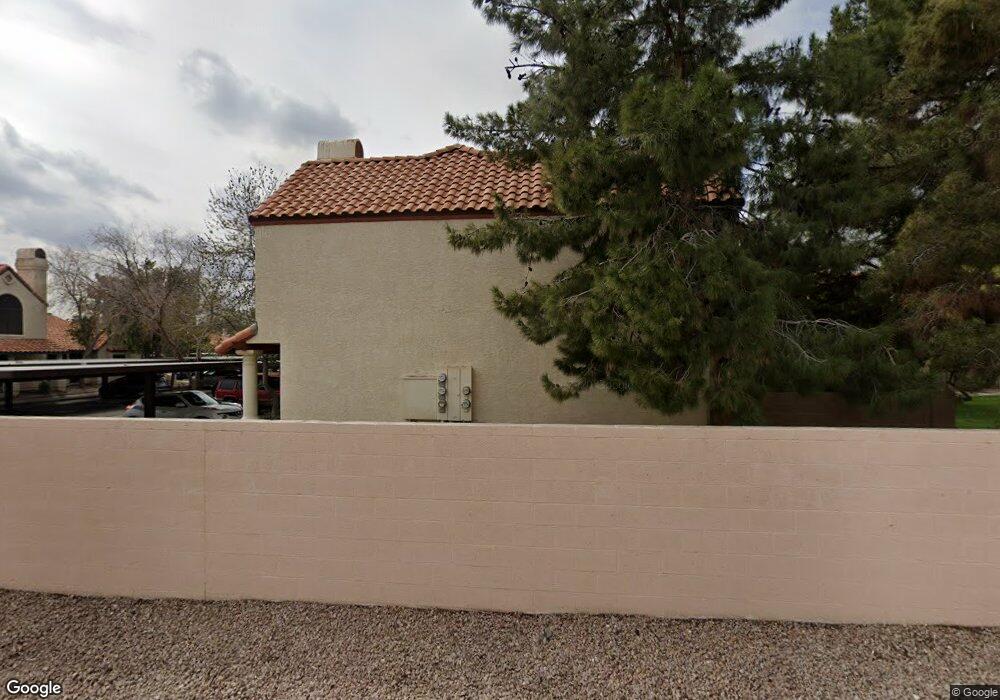
921 W University Dr Unit 1039 Mesa, AZ 85201
West Main NeighborhoodEstimated Value: $272,000 - $308,000
2
Beds
2
Baths
1,000
Sq Ft
$297/Sq Ft
Est. Value
About This Home
This home is located at 921 W University Dr Unit 1039, Mesa, AZ 85201 and is currently estimated at $297,065, approximately $297 per square foot. 921 W University Dr Unit 1039 is a home located in Maricopa County with nearby schools including Franklin at Brimhall Elementary School, Emerson Elementary School, and Franklin West Elementary School.
Ownership History
Date
Name
Owned For
Owner Type
Purchase Details
Closed on
Jul 12, 2023
Sold by
Khan Tarek and Khan Shamsa T
Bought by
Khan Family Trust and Khan
Current Estimated Value
Purchase Details
Closed on
Mar 6, 2013
Sold by
Smith Ronald L and Smith Ellen E
Bought by
Khan Tarek and Khan Shamsa T
Home Financials for this Owner
Home Financials are based on the most recent Mortgage that was taken out on this home.
Original Mortgage
$68,000
Interest Rate
3.51%
Mortgage Type
New Conventional
Purchase Details
Closed on
Feb 7, 2006
Sold by
Vescor Holdings Llc
Bought by
Bourassa Kristen and Johnson Trevor
Home Financials for this Owner
Home Financials are based on the most recent Mortgage that was taken out on this home.
Original Mortgage
$142,837
Interest Rate
6.16%
Mortgage Type
FHA
Create a Home Valuation Report for This Property
The Home Valuation Report is an in-depth analysis detailing your home's value as well as a comparison with similar homes in the area
Home Values in the Area
Average Home Value in this Area
Purchase History
| Date | Buyer | Sale Price | Title Company |
|---|---|---|---|
| Khan Family Trust | -- | None Listed On Document | |
| Khan Tarek | $92,000 | Lawyers Title Of Arizona Inc | |
| Bourassa Kristen | $145,000 | Lawyers Title Insurance Corp |
Source: Public Records
Mortgage History
| Date | Status | Borrower | Loan Amount |
|---|---|---|---|
| Previous Owner | Khan Tarek | $68,000 | |
| Previous Owner | Bourassa Kristen | $142,837 |
Source: Public Records
Tax History Compared to Growth
Tax History
| Year | Tax Paid | Tax Assessment Tax Assessment Total Assessment is a certain percentage of the fair market value that is determined by local assessors to be the total taxable value of land and additions on the property. | Land | Improvement |
|---|---|---|---|---|
| 2025 | $655 | $6,679 | -- | -- |
| 2024 | $661 | $6,361 | -- | -- |
| 2023 | $661 | $20,180 | $4,030 | $16,150 |
| 2022 | $647 | $15,480 | $3,090 | $12,390 |
| 2021 | $655 | $13,630 | $2,720 | $10,910 |
| 2020 | $647 | $12,580 | $2,510 | $10,070 |
| 2019 | $604 | $10,450 | $2,090 | $8,360 |
| 2018 | $580 | $8,400 | $1,680 | $6,720 |
| 2017 | $563 | $7,760 | $1,550 | $6,210 |
| 2016 | $552 | $7,960 | $1,590 | $6,370 |
| 2015 | $519 | $6,620 | $1,320 | $5,300 |
Source: Public Records
Map
Nearby Homes
- 921 W University Dr Unit 1191
- 921 W University Dr Unit 1038
- 921 W University Dr Unit 1101
- 710 W 1st St
- 633 W 1st St
- 639 W Pepper Place Unit 107
- 639 W Pepper Place Unit A102
- 639 W Pepper Place Unit 109
- 141 N Date Unit 6
- 141 N Date Unit 7
- 961 W Main St Unit 1
- 1134 W 2nd St
- 432 W 1st St
- 1028 W 5th St
- 42 S Vineyard
- 1239 W 1st Place
- 420 W Mahoney Ave
- 455 W 5th Place
- 227 N Morris
- 340 W University Dr Unit 1
- 921 W University Dr Unit 1087
- 921 W University Dr Unit 1020
- 921 W University Dr Unit 1104
- 921 W University Dr Unit 1132
- 921 W University Dr Unit 1142
- 921 W University Dr Unit 1091
- 921 W University Dr Unit 1043
- 921 W University Dr Unit 1161
- 921 W University Dr Unit 1163
- 921 W University Dr Unit 1185
- 921 W University Dr Unit 1129
- 921 W University Dr Unit 1183
- 921 W University Dr Unit 1093
- 921 W University Dr Unit 1160
- 921 W University Dr Unit 1112
- 921 W University Dr Unit 1047
- 921 W University Dr Unit 1233
- 921 W University Dr Unit 1039
- 921 W University Dr Unit 1042
- 921 W University Dr Unit 1083