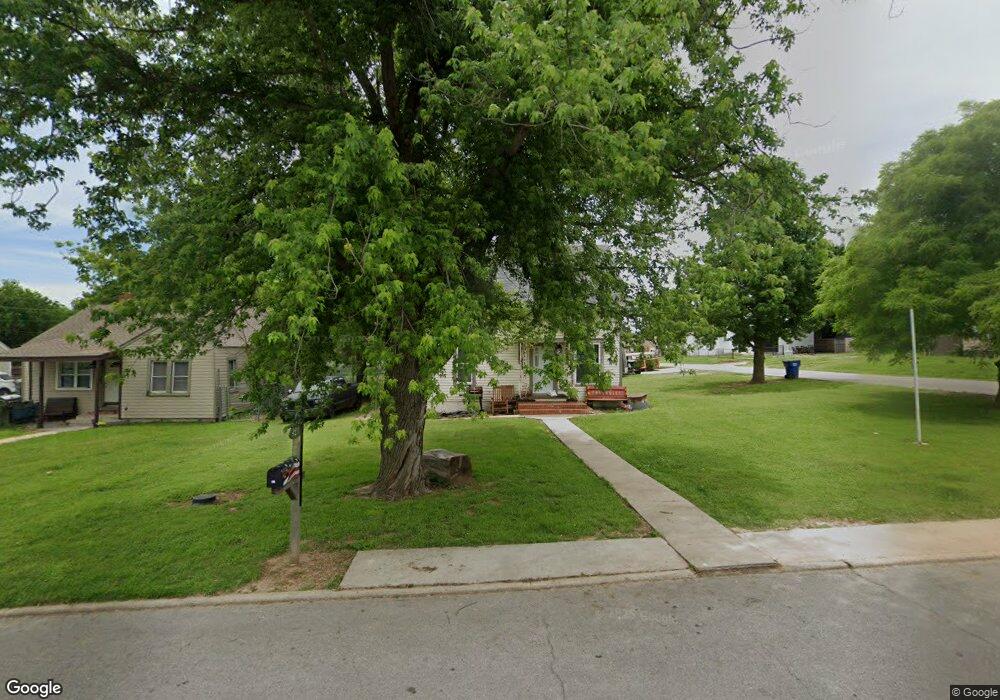
921 W Wade St El Reno, OK 73036
Estimated Value: $154,000 - $172,742
3
Beds
2
Baths
2,054
Sq Ft
$78/Sq Ft
Est. Value
About This Home
This home is located at 921 W Wade St, El Reno, OK 73036 and is currently estimated at $161,186, approximately $78 per square foot. 921 W Wade St is a home located in Canadian County with nearby schools including Hillcrest Elementary School, Rose Witcher Elementary School, and Lincoln Learning Center.
Ownership History
Date
Name
Owned For
Owner Type
Purchase Details
Closed on
Apr 5, 2021
Sold by
Zajic Robert W and Zajic Fern R
Bought by
Hughes Eric Scott and Simpson Sarah D
Current Estimated Value
Purchase Details
Closed on
Dec 7, 2009
Sold by
Chronister Justin T and Chronister Jamie M
Bought by
Zajic Robert W and Zajic Fern R
Home Financials for this Owner
Home Financials are based on the most recent Mortgage that was taken out on this home.
Original Mortgage
$30,000
Interest Rate
4.82%
Mortgage Type
Unknown
Purchase Details
Closed on
Nov 18, 2009
Sold by
Shea Yvonne and Bremseth Gerald
Bought by
Chronister Justin T and Chronister Jamie M
Home Financials for this Owner
Home Financials are based on the most recent Mortgage that was taken out on this home.
Original Mortgage
$30,000
Interest Rate
4.82%
Mortgage Type
Unknown
Purchase Details
Closed on
Dec 29, 2006
Sold by
Shea Yvonne
Bought by
Shea Yvonne and Bremseth Gerald
Purchase Details
Closed on
Aug 22, 2000
Sold by
Bremseth Frances C
Create a Home Valuation Report for This Property
The Home Valuation Report is an in-depth analysis detailing your home's value as well as a comparison with similar homes in the area
Home Values in the Area
Average Home Value in this Area
Purchase History
| Date | Buyer | Sale Price | Title Company |
|---|---|---|---|
| Hughes Eric Scott | $115,000 | None Available | |
| Zajic Robert W | -- | Agt | |
| Chronister Justin T | $35,000 | Agt | |
| Shea Yvonne | -- | None Available | |
| -- | -- | -- |
Source: Public Records
Mortgage History
| Date | Status | Borrower | Loan Amount |
|---|---|---|---|
| Previous Owner | Zajic Robert W | $30,000 |
Source: Public Records
Tax History Compared to Growth
Tax History
| Year | Tax Paid | Tax Assessment Tax Assessment Total Assessment is a certain percentage of the fair market value that is determined by local assessors to be the total taxable value of land and additions on the property. | Land | Improvement |
|---|---|---|---|---|
| 2024 | $744 | $7,296 | $720 | $6,576 |
| 2023 | $744 | $6,949 | $900 | $6,049 |
| 2022 | $712 | $6,618 | $900 | $5,718 |
| 2021 | $699 | $6,341 | $900 | $5,441 |
| 2020 | $657 | $6,039 | $900 | $5,139 |
| 2019 | $654 | $5,751 | $900 | $4,851 |
| 2018 | $616 | $5,478 | $900 | $4,578 |
| 2017 | $599 | $5,217 | $900 | $4,317 |
| 2016 | $574 | $5,217 | $900 | $4,317 |
| 2015 | $512 | $4,732 | $900 | $3,832 |
| 2014 | $512 | $4,507 | $900 | $3,607 |
Source: Public Records
Map
Nearby Homes
- 1117 W London St
- 710 Sunset Dr
- 508 S Morrison Ave
- 211 S Ellison Ave
- 520 S Hadden Ave
- 516 S Morrison Ave
- 116 N Mahan Ave
- 1108 W Hayes St
- 407 W Wade St
- 601 S Fillmore Ave
- 623 S Ellison Ave
- 709 S Hadden Ave
- 1312 W Shuttee St
- 111 N Admire Ave
- 506 S Evans Ave
- 1501 W Watts St
- 0 Foreman Rd
- 320 N Miles Ave
- 717 S Miles Ave
- 418 W Penn St
- 917 W Wade St
- 504 W Wade St
- 915 W Wade St
- 1001 W Wade St
- 914 W Wade St
- 920 W Wade St
- 916 W London St
- 920 W London St
- 1003 W Wade St
- 914 W London St
- 912 W Wade St
- 1000 W London St
- 1000 W Wade St
- 904 W London St
- 910 W Wade St
- 1005 W Wade St
- 1004 W Wade St
- 821 W Wade St
- 1006 W London St
- 1008 W London St