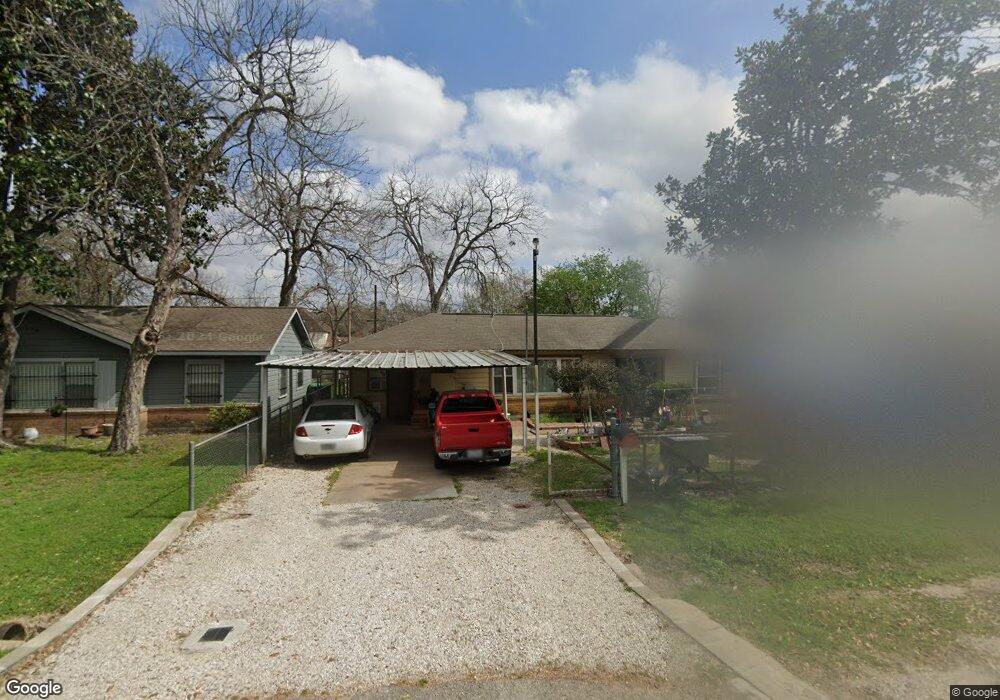
9210 Carrick St Houston, TX 77022
Northside-Northline NeighborhoodEstimated Value: $186,984 - $226,000
2
Beds
1
Bath
725
Sq Ft
$284/Sq Ft
Est. Value
About This Home
This home is located at 9210 Carrick St, Houston, TX 77022 and is currently estimated at $206,246, approximately $284 per square foot. 9210 Carrick St is a home located in Harris County with nearby schools including Burbank Elementary School, Burbank Middle School, and Sam Houston Math, Science & Technology Center.
Ownership History
Date
Name
Owned For
Owner Type
Purchase Details
Closed on
Jan 21, 2005
Sold by
White Rodney Dewayne and White Kari
Bought by
Vides Jose Adonias
Current Estimated Value
Home Financials for this Owner
Home Financials are based on the most recent Mortgage that was taken out on this home.
Original Mortgage
$72,750
Outstanding Balance
$36,973
Interest Rate
5.85%
Mortgage Type
Purchase Money Mortgage
Estimated Equity
$169,273
Purchase Details
Closed on
May 23, 1995
Sold by
King Donna Frances and Muir Donna Frances
Bought by
White Rodney Dewayne
Home Financials for this Owner
Home Financials are based on the most recent Mortgage that was taken out on this home.
Original Mortgage
$22,000
Interest Rate
8.34%
Mortgage Type
Seller Take Back
Create a Home Valuation Report for This Property
The Home Valuation Report is an in-depth analysis detailing your home's value as well as a comparison with similar homes in the area
Home Values in the Area
Average Home Value in this Area
Purchase History
| Date | Buyer | Sale Price | Title Company |
|---|---|---|---|
| Vides Jose Adonias | -- | -- | |
| White Rodney Dewayne | -- | Stewart Title |
Source: Public Records
Mortgage History
| Date | Status | Borrower | Loan Amount |
|---|---|---|---|
| Open | Vides Jose Adonias | $72,750 | |
| Previous Owner | White Rodney Dewayne | $22,000 |
Source: Public Records
Tax History Compared to Growth
Tax History
| Year | Tax Paid | Tax Assessment Tax Assessment Total Assessment is a certain percentage of the fair market value that is determined by local assessors to be the total taxable value of land and additions on the property. | Land | Improvement |
|---|---|---|---|---|
| 2025 | $1,672 | $184,880 | $70,586 | $114,294 |
| 2024 | $1,672 | $185,833 | $70,586 | $115,247 |
| 2023 | $1,672 | $170,740 | $70,586 | $100,154 |
| 2022 | $2,757 | $138,075 | $53,780 | $84,295 |
| 2021 | $2,653 | $135,010 | $53,780 | $81,230 |
| 2020 | $2,506 | $116,372 | $53,780 | $62,592 |
| 2019 | $2,381 | $100,055 | $35,294 | $64,761 |
| 2018 | $1,438 | $85,536 | $35,294 | $50,242 |
| 2017 | $2,163 | $85,536 | $35,294 | $50,242 |
| 2016 | $2,108 | $83,359 | $35,294 | $48,065 |
| 2015 | $1,307 | $83,371 | $35,294 | $48,077 |
| 2014 | $1,307 | $71,905 | $35,294 | $36,611 |
Source: Public Records
Map
Nearby Homes
- 70 Burress St
- 90 Burress St Unit B
- 90 Burress St Unit A
- 9625 Fulton St
- 44 Farrell St
- 91 Burbank St
- 61 Trenwood Ln
- 0 Burbank St Unit 9886770
- 104 Luetta St
- 106 Luetta St
- 108 Luetta St
- 108 Fichter St
- 110 Luetta St
- 45 Wellford St
- 56 Wellford St
- 9816 Fulton St
- 202 Burbank St
- 216 Burress St
- 249 De Boll St
- 58 Dipping Ln
- 9214 Carrick St
- 9206 Carrick St
- 9202 Carrick St
- 9218 Carrick St
- 9211 Carrick St
- 63 De Boll St
- 9215 Carrick St
- 65 De Boll St
- 9207 Carrick St
- 58 Veenstra St
- 61 De Boll St
- 67 De Boll St
- 9219 Carrick St
- 9203 Carrick St
- 59 De Boll St
- 60 Veenstra St
- 71 De Boll St
- 55 De Boll St
- 53 De Boll St
- 53 Veenstra St