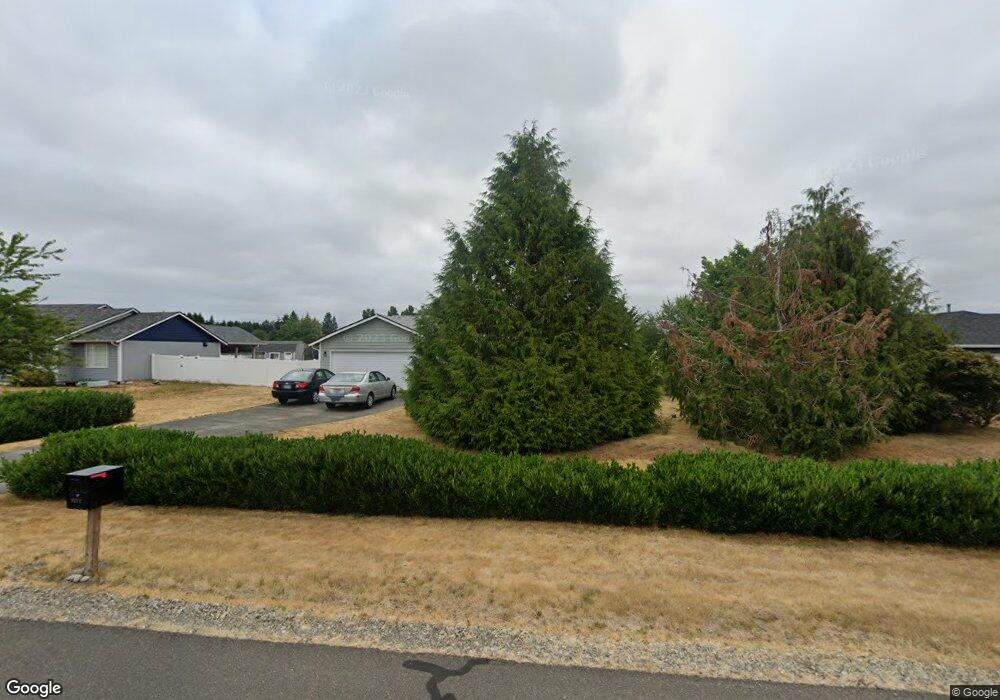
9211 Applegate Loop SW Rochester, WA 98579
Estimated Value: $501,792 - $556,000
3
Beds
2
Baths
1,710
Sq Ft
$312/Sq Ft
Est. Value
About This Home
This home is located at 9211 Applegate Loop SW, Rochester, WA 98579 and is currently estimated at $533,448, approximately $311 per square foot. 9211 Applegate Loop SW is a home located in Thurston County with nearby schools including Rochester Primary School, Grand Mound Elementary School, and Rochester Middle School.
Ownership History
Date
Name
Owned For
Owner Type
Purchase Details
Closed on
Apr 15, 2003
Sold by
Ragland James E
Bought by
Ragland James E and Jiang Xiping
Current Estimated Value
Purchase Details
Closed on
Jul 25, 2001
Sold by
Ragland James E
Bought by
Ragland James E and The Ragland Family Living Trust
Purchase Details
Closed on
Jun 15, 2001
Sold by
Ragland James E and Chang Susan
Bought by
Ragland James E
Purchase Details
Closed on
Apr 17, 2001
Sold by
Ragland James E
Bought by
Ragland James E and Chang Susan
Purchase Details
Closed on
Sep 21, 1999
Sold by
Ingersoll Donald M and Ingersoll Patricia J
Bought by
Ragland James E
Home Financials for this Owner
Home Financials are based on the most recent Mortgage that was taken out on this home.
Original Mortgage
$60,000
Interest Rate
7.97%
Mortgage Type
Balloon
Create a Home Valuation Report for This Property
The Home Valuation Report is an in-depth analysis detailing your home's value as well as a comparison with similar homes in the area
Home Values in the Area
Average Home Value in this Area
Purchase History
| Date | Buyer | Sale Price | Title Company |
|---|---|---|---|
| Ragland James E | -- | -- | |
| Ragland James E | -- | -- | |
| Ragland James E | -- | Thurston County Title Compan | |
| Ragland James E | -- | Thurston County Title Co | |
| Ragland James E | -- | Thurston County Title Co |
Source: Public Records
Mortgage History
| Date | Status | Borrower | Loan Amount |
|---|---|---|---|
| Previous Owner | Ragland James E | $60,000 |
Source: Public Records
Tax History
| Year | Tax Paid | Tax Assessment Tax Assessment Total Assessment is a certain percentage of the fair market value that is determined by local assessors to be the total taxable value of land and additions on the property. | Land | Improvement |
|---|---|---|---|---|
| 2025 | $3,500 | $428,400 | $133,500 | $294,900 |
| 2024 | $3,500 | $424,000 | $138,800 | $285,200 |
| 2023 | $3,500 | $404,600 | $104,500 | $300,100 |
| 2022 | $3,037 | $395,000 | $79,200 | $315,800 |
| 2021 | $2,780 | $295,200 | $83,200 | $212,000 |
| 2020 | $2,964 | $248,300 | $45,100 | $203,200 |
| 2019 | $2,651 | $220,600 | $48,800 | $171,800 |
| 2018 | $2,925 | $204,600 | $46,000 | $158,600 |
| 2017 | $2,821 | $199,500 | $39,800 | $159,700 |
| 2016 | $2,529 | $180,500 | $42,000 | $138,500 |
| 2014 | -- | $175,050 | $44,150 | $130,900 |
Source: Public Records
Map
Nearby Homes
- 9235 180th Ln SW
- 18000 Applegate St SW
- 9321 179th Ln SW
- 8826 183rd Ave SW
- 17912 Daryl Ln SW
- 17927 Daryl Ln SW
- 12630 183rd Ave SW
- 12624 183rd Ave SW
- 8548 178th Ave SW
- 17211 Hound Dog Ln SW
- 8838 173rd Ave SW
- 18602 Paulson St SW
- 0 Roseburg St SW Unit NWM2371565
- 9538 184th Ave SW
- 18420 Albany St SW
- 18343 Albany St SW
- 17837 Sargent Rd SW
- 17340 Sargent Rd SW Unit 35
- 17340 Sargent Rd SW Unit 54
- 17340 Sargent Rd SW Unit 66
- 9209 Applegate Loop SW
- 9215 Applegate Loop SW
- 9207 Applegate Loop SW
- 9217 Applegate Loop SW
- 18033 Cider Ct SW
- 18125 Cider Ct SW
- 9219 Applegate Loop SW
- 9210 Applegate Loop SW
- 9208 Applegate Loop SW
- 9131 Applegate Loop SW
- 9125 Applegate Loop SW
- 9206 Applegate Loop SW
- 18124 Cider Ct SW
- 9221 Applegate Loop SW
- 18021 Cider Ct SW
- 9214 Applegate Loop SW
- 18040 Cider Ct SW
- 9212 Applegate Loop SW
- 18110 Cider Ct SW
- 9204 Applegate Loop SW
Your Personal Tour Guide
Ask me questions while you tour the home.