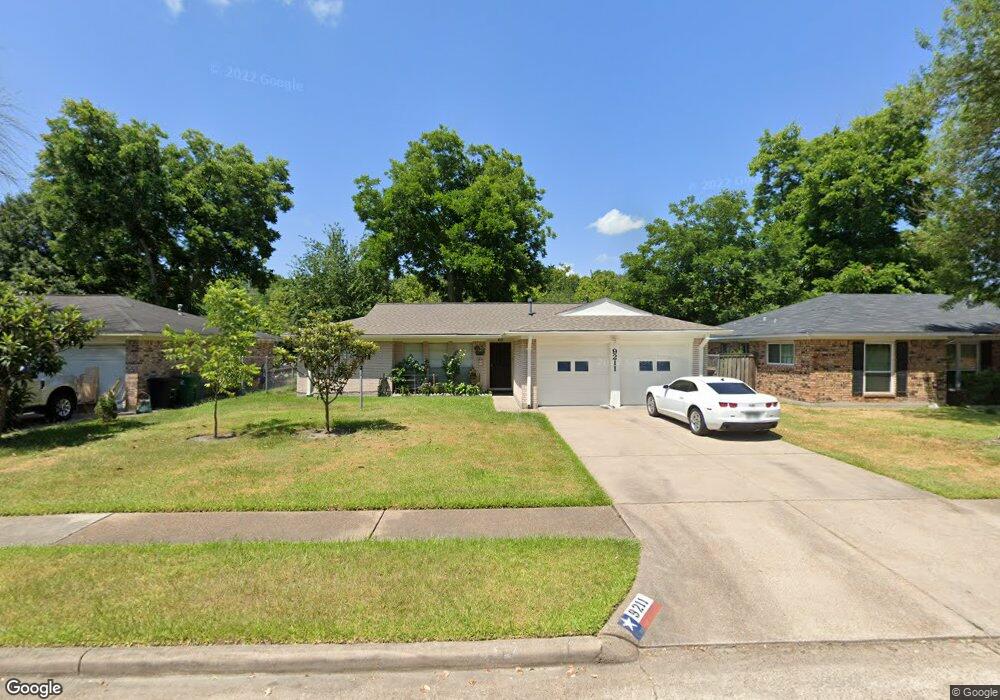
9211 Glen Shadow Dr Houston, TX 77088
Hidden Valley NeighborhoodEstimated Value: $190,607 - $230,000
3
Beds
2
Baths
1,183
Sq Ft
$180/Sq Ft
Est. Value
About This Home
This home is located at 9211 Glen Shadow Dr, Houston, TX 77088 and is currently estimated at $212,402, approximately $179 per square foot. 9211 Glen Shadow Dr is a home located in Harris County with nearby schools including Jerry Keeble Ec/Pre-K, Goodman Elementary School, and Aldine Ninth Grade School.
Ownership History
Date
Name
Owned For
Owner Type
Purchase Details
Closed on
Nov 10, 2003
Sold by
Banco Popular North America
Bought by
Cruz Martir and Cruz Anna Maria Concepion
Current Estimated Value
Home Financials for this Owner
Home Financials are based on the most recent Mortgage that was taken out on this home.
Original Mortgage
$88,511
Outstanding Balance
$40,491
Interest Rate
5.81%
Mortgage Type
FHA
Estimated Equity
$171,911
Purchase Details
Closed on
Jul 2, 2003
Sold by
Mendoza Antonio M and Mendoza Irene
Bought by
Banco Popular North America
Purchase Details
Closed on
Jan 16, 2001
Sold by
Hood Nelda Jo and Reneau Henrietta Sue
Bought by
Mendoza Antonio M and Mendoza Irene
Home Financials for this Owner
Home Financials are based on the most recent Mortgage that was taken out on this home.
Original Mortgage
$78,525
Interest Rate
7.55%
Create a Home Valuation Report for This Property
The Home Valuation Report is an in-depth analysis detailing your home's value as well as a comparison with similar homes in the area
Home Values in the Area
Average Home Value in this Area
Purchase History
| Date | Buyer | Sale Price | Title Company |
|---|---|---|---|
| Cruz Martir | -- | Texas American Title Company | |
| Banco Popular North America | $69,732 | -- | |
| Mendoza Antonio M | -- | -- |
Source: Public Records
Mortgage History
| Date | Status | Borrower | Loan Amount |
|---|---|---|---|
| Open | Cruz Martir | $88,511 | |
| Previous Owner | Mendoza Antonio M | $78,525 |
Source: Public Records
Tax History Compared to Growth
Tax History
| Year | Tax Paid | Tax Assessment Tax Assessment Total Assessment is a certain percentage of the fair market value that is determined by local assessors to be the total taxable value of land and additions on the property. | Land | Improvement |
|---|---|---|---|---|
| 2025 | $22 | $187,736 | $55,980 | $131,756 |
| 2024 | $22 | $167,279 | $39,986 | $127,293 |
| 2023 | $22 | $174,269 | $39,986 | $134,283 |
| 2022 | $3,183 | $138,736 | $34,770 | $103,966 |
| 2021 | $3,030 | $120,646 | $19,124 | $101,522 |
| 2020 | $3,156 | $120,646 | $19,124 | $101,522 |
| 2019 | $3,008 | $108,706 | $18,876 | $89,830 |
| 2018 | $1,089 | $101,093 | $18,876 | $82,217 |
| 2017 | $2,432 | $101,093 | $18,876 | $82,217 |
| 2016 | $2,211 | $95,196 | $18,876 | $76,320 |
| 2015 | $1,460 | $95,196 | $18,876 | $76,320 |
| 2014 | $1,460 | $74,831 | $18,876 | $55,955 |
Source: Public Records
Map
Nearby Homes
- 1330 Mosher Ln
- 1326 Twin Falls Rd
- 1615 Mosher Ln
- 1710 Beaver Bend Rd
- 0 Veterans Memorial Rd Unit 43555293
- 1119 Twin Falls Rd
- 1102 Mosher Ln
- 1806 Saddle Rock Dr Unit 770
- 1907 Bunzel St
- 8835 Glenhouse Dr
- 1011 Beaver Bend Rd
- 1707 Winter Bay Ln
- 2110 Mosher Ln
- 907 Twin Falls Rd
- 8615 Citation Ct
- 9006 Winding River Dr
- 8718 Glen Shadow Dr
- 9710 Debbie Ln
- 2146 Twinbrooke Dr
- 9018 Lazy River Ln
- 9207 Glen Shadow Dr
- 9215 Glen Shadow Dr
- 9203 Glen Shadow Dr
- 9219 Glen Shadow Dr
- 9214 Glen Shadow Dr
- 9139 Glen Shadow Dr
- 9223 Glen Shadow Dr
- 9206 Glen Shadow Dr
- 9218 Glen Shadow Dr
- 9202 Glen Shadow Dr
- 9135 Glen Shadow Dr
- 9227 Glen Shadow Dr
- 9222 Glen Shadow Dr
- 9211 Still River Dr
- 9207 Still River Dr
- 9131 Glen Shadow Dr
- 9231 Glen Shadow Dr
- 9215 Still River Dr
- 9203 Still River Dr
- 1335 Helms Rd