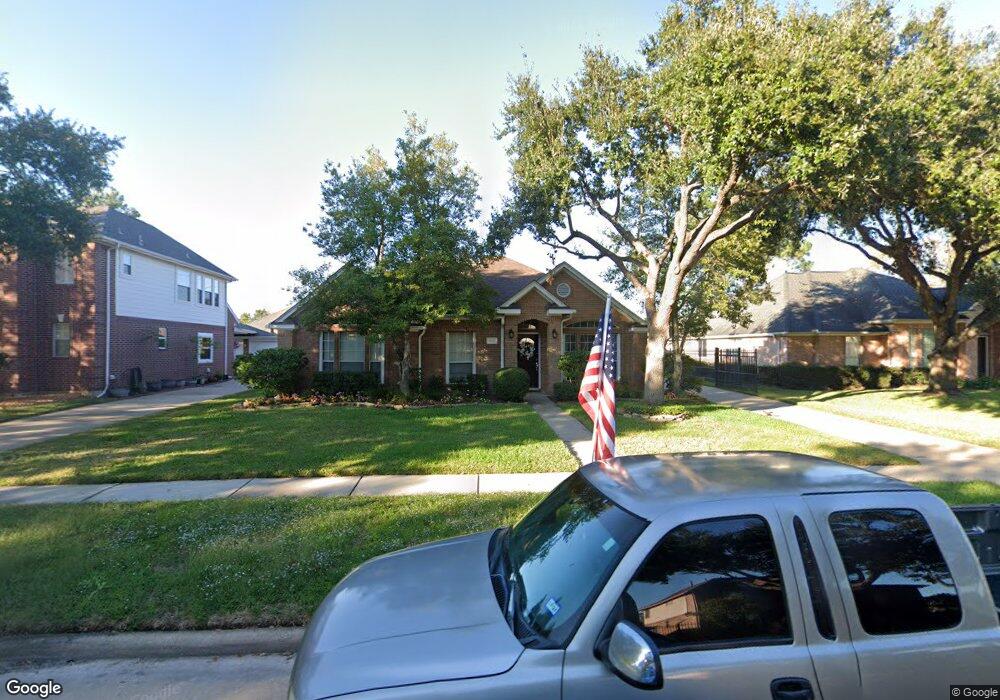
9211 Newburgh Dr Houston, TX 77095
Estimated Value: $336,000 - $368,142
4
Beds
2
Baths
2,232
Sq Ft
$159/Sq Ft
Est. Value
About This Home
This home is located at 9211 Newburgh Dr, Houston, TX 77095 and is currently estimated at $355,286, approximately $159 per square foot. 9211 Newburgh Dr is a home located in Harris County with nearby schools including Fiest Elementary School, Labay Middle School, and Cypress Falls High School.
Ownership History
Date
Name
Owned For
Owner Type
Purchase Details
Closed on
Jan 30, 2006
Sold by
Deal Jerry R and Deal Cheryl L
Bought by
Adkison Mary Ellen
Current Estimated Value
Home Financials for this Owner
Home Financials are based on the most recent Mortgage that was taken out on this home.
Original Mortgage
$101,250
Outstanding Balance
$57,135
Interest Rate
6.24%
Mortgage Type
Fannie Mae Freddie Mac
Estimated Equity
$298,151
Purchase Details
Closed on
Sep 29, 1995
Sold by
Imperial Homes/Aberdeen Lc
Bought by
Deal Jerry R and Deal Cheryl L
Home Financials for this Owner
Home Financials are based on the most recent Mortgage that was taken out on this home.
Original Mortgage
$117,300
Interest Rate
7.62%
Create a Home Valuation Report for This Property
The Home Valuation Report is an in-depth analysis detailing your home's value as well as a comparison with similar homes in the area
Home Values in the Area
Average Home Value in this Area
Purchase History
| Date | Buyer | Sale Price | Title Company |
|---|---|---|---|
| Adkison Mary Ellen | -- | Stewart Title Company | |
| Deal Jerry R | -- | -- |
Source: Public Records
Mortgage History
| Date | Status | Borrower | Loan Amount |
|---|---|---|---|
| Open | Adkison Mary Ellen | $101,250 | |
| Previous Owner | Deal Jerry R | $117,300 |
Source: Public Records
Tax History Compared to Growth
Tax History
| Year | Tax Paid | Tax Assessment Tax Assessment Total Assessment is a certain percentage of the fair market value that is determined by local assessors to be the total taxable value of land and additions on the property. | Land | Improvement |
|---|---|---|---|---|
| 2025 | $1,477 | $322,385 | $85,301 | $237,084 |
| 2024 | $1,477 | $358,253 | $71,158 | $287,095 |
| 2023 | $1,477 | $341,204 | $71,158 | $270,046 |
| 2022 | $6,035 | $275,529 | $53,920 | $221,609 |
| 2021 | $5,806 | $224,095 | $53,920 | $170,175 |
| 2020 | $5,857 | $216,988 | $44,639 | $172,349 |
| 2019 | $6,068 | $218,203 | $43,756 | $174,447 |
| 2018 | $3,003 | $208,535 | $43,756 | $164,779 |
| 2017 | $5,506 | $196,898 | $43,756 | $153,142 |
| 2016 | $5,506 | $196,898 | $43,756 | $153,142 |
| 2015 | $4,991 | $185,126 | $43,756 | $141,370 |
| 2014 | $4,991 | $173,671 | $43,756 | $129,915 |
Source: Public Records
Map
Nearby Homes
- 9138 Shango Ln
- 9111 Sunny Ridge Dr
- 15906 Marwick Ct
- 15802 Aberdeen Trails Dr
- 9303 Reston Grove Ln
- 8818 Apple Mill Dr
- 8814 Sherina Park Dr
- 15735 Jamie Lee Dr
- 15627 Kentwater Ct
- 15610 Manorford Ct
- 16111 Aberdeen Forest Dr
- 21218 Branchport Dr
- 16123 Aberdeen Forest Dr
- 21327 Colton Cove Dr
- 15610 Tarpon Springs Ct
- 15407 Copper Branch Ln
- 16211 Green Smoke Dr
- 8526 Greenleaf Lake Dr
- 15634 Haleys Landing Ln
- 8835 Aberdeen Park Dr
- 9207 Newburgh Dr
- 9215 Newburgh Dr
- 9203 Newburgh Dr
- 9219 Newburgh Dr
- 9206 Newburgh Dr
- 9210 Newburgh Dr
- 9202 Newburgh Dr
- 9131 Newburgh Dr
- 9127 Newburgh Dr
- 9030 Bonnyview Dr
- 9139 Shango Ln
- 9126 Newburgh Dr
- 9135 Shango Ln
- 9143 Shango Ln
- 9131 Shango Ln
- 9203 Shango Ln
- 9123 Newburgh Dr
- 9127 Shango Ln
- 9026 Bonnyview Dr
- 9027 Bonnyview Dr