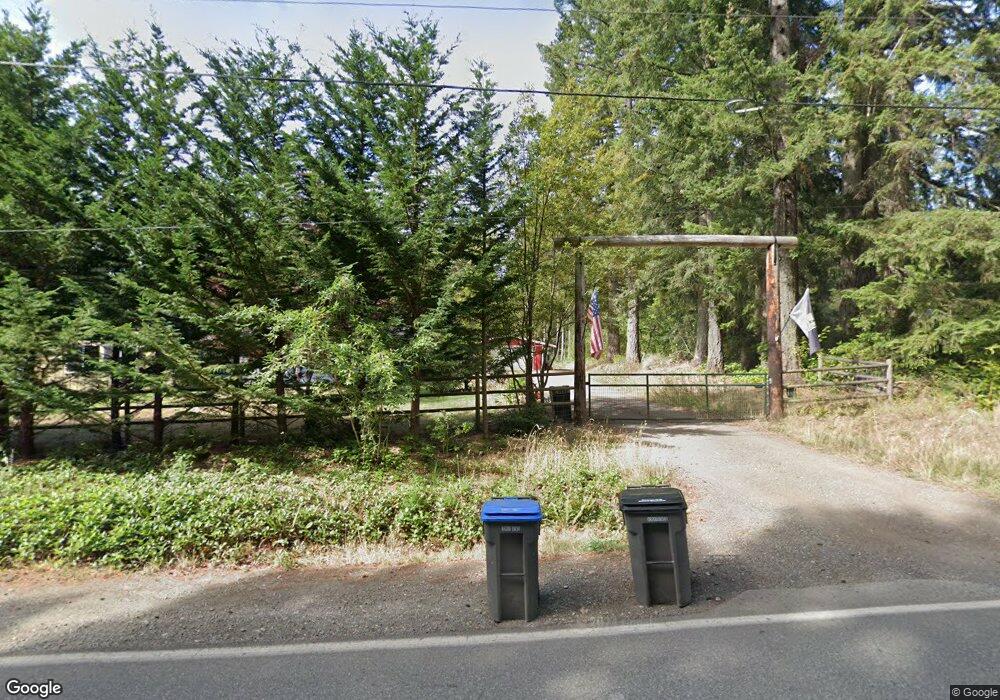
9211 Orchard Ave SE Port Orchard, WA 98367
Estimated Value: $684,000 - $890,000
3
Beds
2
Baths
1,586
Sq Ft
$492/Sq Ft
Est. Value
About This Home
This home is located at 9211 Orchard Ave SE, Port Orchard, WA 98367 and is currently estimated at $780,569, approximately $492 per square foot. 9211 Orchard Ave SE is a home located in Kitsap County with nearby schools including Olalla Elementary School, John Sedgwick Middle School, and South Kitsap High School.
Ownership History
Date
Name
Owned For
Owner Type
Purchase Details
Closed on
Jul 21, 2000
Sold by
Gates Ronald L and Gates Diana J
Bought by
Carlson Mark R and Carlson Virginia R
Current Estimated Value
Home Financials for this Owner
Home Financials are based on the most recent Mortgage that was taken out on this home.
Original Mortgage
$205,000
Outstanding Balance
$73,200
Interest Rate
8.2%
Estimated Equity
$707,369
Purchase Details
Closed on
Nov 1, 1994
Sold by
Iversen Jane R
Bought by
Gates Ronald L and Gates Diana J
Home Financials for this Owner
Home Financials are based on the most recent Mortgage that was taken out on this home.
Original Mortgage
$136,000
Interest Rate
8.78%
Create a Home Valuation Report for This Property
The Home Valuation Report is an in-depth analysis detailing your home's value as well as a comparison with similar homes in the area
Home Values in the Area
Average Home Value in this Area
Purchase History
| Date | Buyer | Sale Price | Title Company |
|---|---|---|---|
| Carlson Mark R | $225,000 | Land Title Company | |
| Gates Ronald L | $170,000 | Charter Title Corp |
Source: Public Records
Mortgage History
| Date | Status | Borrower | Loan Amount |
|---|---|---|---|
| Open | Carlson Mark R | $205,000 | |
| Previous Owner | Gates Ronald L | $136,000 |
Source: Public Records
Tax History Compared to Growth
Tax History
| Year | Tax Paid | Tax Assessment Tax Assessment Total Assessment is a certain percentage of the fair market value that is determined by local assessors to be the total taxable value of land and additions on the property. | Land | Improvement |
|---|---|---|---|---|
| 2026 | $5,973 | $687,450 | $292,820 | $394,630 |
| 2025 | $5,973 | $687,450 | $292,820 | $394,630 |
| 2024 | $5,792 | $687,450 | $292,820 | $394,630 |
| 2023 | $5,754 | $687,450 | $292,820 | $394,630 |
| 2022 | $5,543 | $554,570 | $234,260 | $320,310 |
| 2021 | $5,198 | $491,490 | $209,160 | $282,330 |
| 2020 | $4,661 | $427,190 | $154,540 | $272,650 |
| 2019 | $3,958 | $397,980 | $143,410 | $254,570 |
| 2018 | $4,240 | $337,870 | $129,810 | $208,060 |
| 2017 | $3,702 | $337,870 | $129,810 | $208,060 |
| 2016 | $3,693 | $308,430 | $123,630 | $184,800 |
| 2015 | $3,599 | $304,560 | $123,630 | $180,930 |
| 2014 | -- | $308,820 | $149,410 | $159,410 |
| 2013 | -- | $308,820 | $149,410 | $159,410 |
Source: Public Records
Map
Nearby Homes
- 9045 SE Fragaria Rd
- 9904 Banner Rd SE
- 9535 Olalla Valley Rd SE
- 10532 Olalla Valley Rd SE
- 10829 Olalla Valley Rd SE
- 0 SE Banner Rd Unit NWM2438053
- 5621 SE Aloha Ln
- 8610 Long Lake Rd SE
- 5635 SE Aloha Ln
- 0 Long Lake Rd SE Unit NWM2354075
- 8817 Clearwater Ln SE
- 6643 Richards Ave SE
- 9415 SE Goat Trail Rd
- 6556 Mariposa Ln SE
- 8423 Dormar Dr SE
- 6928 SE View Park Rd
- 4752 SE Black Swan Ln
- 6223 Ebbert Dr SE
- 12747 Fetters Ln SE
- 16832 Mcintyre Rd SW
- 9268 Orchard Ave SE
- 9335 Orchard Ave SE
- 9324 Orchard Ave SE
- 9355 Orchard Ave SE
- 7230 SE Snowy Way
- 9345 Orchard Ave SE
- 7262 SE Snowy Way
- 8960 Orchard Ave SE
- 9365 Orchard Ave SE
- 0 Orchard Ave SE Unit 843070
- 0 Orchard Ave SE Unit 771641
- 0 Orchard Ave SE Unit 688412
- 0 Orchard Ave SE Unit NWM595090
- 0 Orchard Ave SE Unit 1761816
- 7231 SE Snowy Way
- 9375 Orchard Ave SE
- 9474 Orchard Ave SE
- 9385 Orchard Ave SE
- 8859 Orchard Ave SE
- 8842 Orchard Ave SE