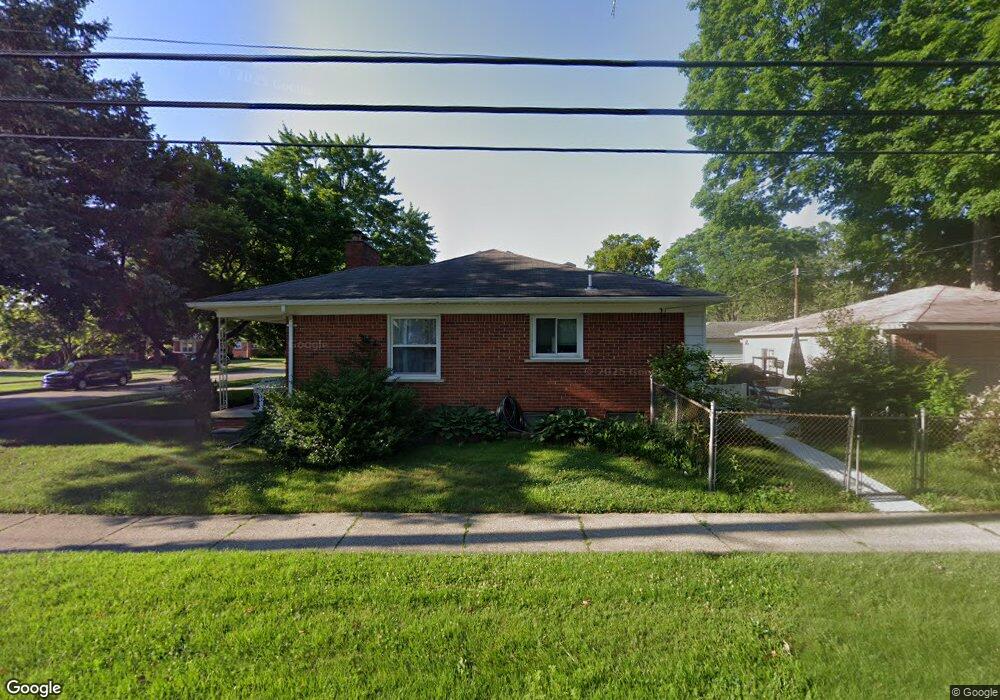
9211 Tecumseh Redford, MI 48239
Estimated Value: $189,529 - $262,000
Studio
1
Bath
1,128
Sq Ft
$196/Sq Ft
Est. Value
About This Home
This home is located at 9211 Tecumseh, Redford, MI 48239 and is currently estimated at $221,132, approximately $196 per square foot. 9211 Tecumseh is a home located in Wayne County with nearby schools including John D. Pierce Middle School, Lee M. Thurston High School, and Westfield Charter Academy.
Ownership History
Date
Name
Owned For
Owner Type
Purchase Details
Closed on
Dec 15, 2006
Sold by
Wojcik Carol and Helen Bator Trust
Bought by
Clyburn Joanne R
Current Estimated Value
Home Financials for this Owner
Home Financials are based on the most recent Mortgage that was taken out on this home.
Original Mortgage
$119,622
Interest Rate
6.27%
Mortgage Type
FHA
Purchase Details
Closed on
Jun 1, 2001
Sold by
Bator Helen
Bought by
Bator Helen
Create a Home Valuation Report for This Property
The Home Valuation Report is an in-depth analysis detailing your home's value as well as a comparison with similar homes in the area
Home Values in the Area
Average Home Value in this Area
Purchase History
| Date | Buyer | Sale Price | Title Company |
|---|---|---|---|
| Clyburn Joanne R | $121,500 | H & H Title Inc | |
| Bator Helen | -- | -- |
Source: Public Records
Mortgage History
| Date | Status | Borrower | Loan Amount |
|---|---|---|---|
| Previous Owner | Clyburn Joanne R | $119,622 |
Source: Public Records
Tax History
| Year | Tax Paid | Tax Assessment Tax Assessment Total Assessment is a certain percentage of the fair market value that is determined by local assessors to be the total taxable value of land and additions on the property. | Land | Improvement |
|---|---|---|---|---|
| 2025 | $870 | $99,400 | $0 | $0 |
| 2024 | $847 | $93,200 | $0 | $0 |
| 2023 | $811 | $82,000 | $0 | $0 |
| 2022 | $2,365 | $73,300 | $0 | $0 |
| 2021 | $2,298 | $69,700 | $0 | $0 |
| 2020 | $2,267 | $61,700 | $0 | $0 |
| 2019 | $2,218 | $54,300 | $0 | $0 |
| 2018 | $730 | $46,500 | $0 | $0 |
| 2017 | $2,525 | $44,000 | $0 | $0 |
| 2016 | $1,968 | $39,500 | $0 | $0 |
| 2015 | $3,066 | $35,200 | $0 | $0 |
| 2013 | $2,970 | $30,400 | $0 | $0 |
| 2012 | $2,293 | $33,000 | $8,000 | $25,000 |
Source: Public Records
Map
Nearby Homes
- 9101 Sioux
- 9010 Leverne
- 26740 Joy Rd Unit 8
- 26760 Joy Rd Unit E8
- 9624 Nathaline
- 26710 Joy Rd Unit A
- 26710 Joy Rd Unit A, 10
- 8915 Sioux
- 26790 Joy Rd Unit 7
- 9983 Hemingway
- 27007 Joy Rd
- 26030 W Chicago
- 9923 Inkster Rd
- 11385 Leverne
- 11417 Leverne
- 11377 Sioux
- 11384 Sioux
- 9114 Cardwell St
- 26923 Constance St
- 11410 Lucerne
Your Personal Tour Guide
Ask me questions while you tour the home.