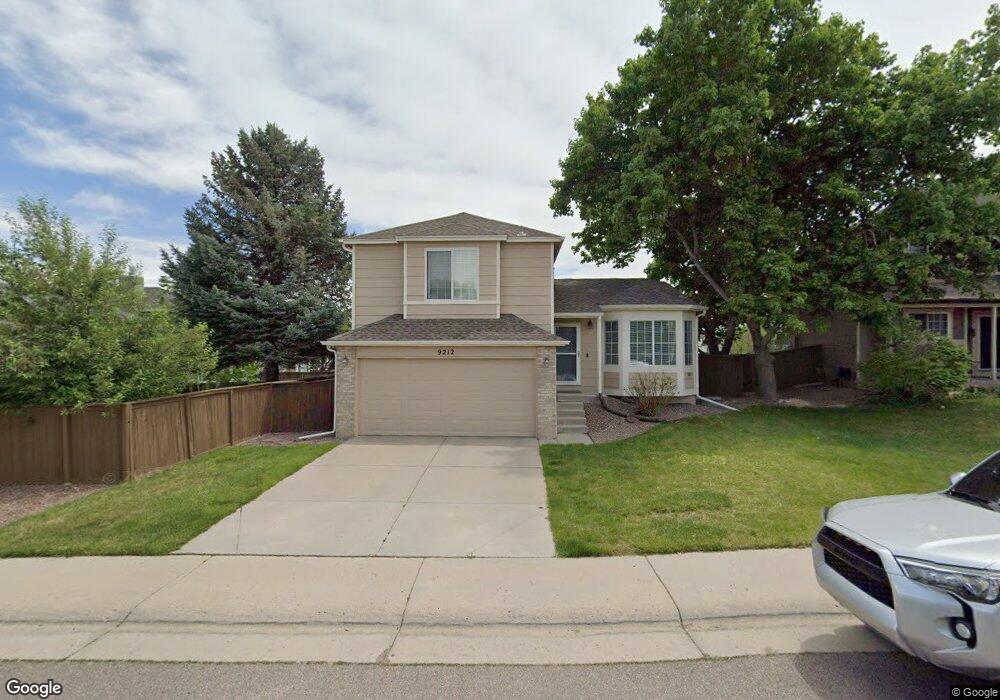
9212 Weeping Willow Ct Highlands Ranch, CO 80130
Eastridge NeighborhoodEstimated Value: $578,000 - $618,000
3
Beds
3
Baths
1,957
Sq Ft
$308/Sq Ft
Est. Value
About This Home
This home is located at 9212 Weeping Willow Ct, Highlands Ranch, CO 80130 and is currently estimated at $602,429, approximately $307 per square foot. 9212 Weeping Willow Ct is a home located in Douglas County with nearby schools including Fox Creek Elementary School, Cresthill Middle School, and Highlands Ranch High School.
Ownership History
Date
Name
Owned For
Owner Type
Purchase Details
Closed on
Jan 12, 2016
Sold by
Rexroth Tara A
Bought by
Hunziker Peter
Current Estimated Value
Home Financials for this Owner
Home Financials are based on the most recent Mortgage that was taken out on this home.
Original Mortgage
$336,775
Outstanding Balance
$267,669
Interest Rate
3.94%
Mortgage Type
New Conventional
Estimated Equity
$334,760
Purchase Details
Closed on
May 30, 2014
Sold by
Rexroth Tara A
Bought by
Rexroth Tara A
Purchase Details
Closed on
Oct 17, 2003
Sold by
Essmeier Gary and Essmeier Tammy G
Bought by
Rexroth Tara A
Home Financials for this Owner
Home Financials are based on the most recent Mortgage that was taken out on this home.
Original Mortgage
$181,200
Interest Rate
5.99%
Mortgage Type
Unknown
Purchase Details
Closed on
May 28, 1992
Sold by
Richmond Homes Inc Ii
Bought by
Essmeier Gary and Essmeier Tammy G
Purchase Details
Closed on
Feb 18, 1992
Sold by
Mission Viejo Co
Bought by
Richmond Homes Inc Ii
Create a Home Valuation Report for This Property
The Home Valuation Report is an in-depth analysis detailing your home's value as well as a comparison with similar homes in the area
Home Values in the Area
Average Home Value in this Area
Purchase History
| Date | Buyer | Sale Price | Title Company |
|---|---|---|---|
| Hunziker Peter | $354,500 | Heritage Title Co | |
| Rexroth Tara A | -- | None Available | |
| Rexroth Tara A | $226,500 | Chicago Title Company | |
| Essmeier Gary | $108,100 | -- | |
| Richmond Homes Inc Ii | $267,200 | -- |
Source: Public Records
Mortgage History
| Date | Status | Borrower | Loan Amount |
|---|---|---|---|
| Open | Hunziker Peter | $336,775 | |
| Previous Owner | Rexroth Tara A | $181,200 | |
| Closed | Rexroth Tara A | $22,650 |
Source: Public Records
Tax History Compared to Growth
Tax History
| Year | Tax Paid | Tax Assessment Tax Assessment Total Assessment is a certain percentage of the fair market value that is determined by local assessors to be the total taxable value of land and additions on the property. | Land | Improvement |
|---|---|---|---|---|
| 2024 | $3,562 | $41,470 | $10,550 | $30,920 |
| 2023 | $3,555 | $41,470 | $10,550 | $30,920 |
| 2022 | $2,770 | $30,320 | $7,220 | $23,100 |
| 2021 | $2,882 | $30,320 | $7,220 | $23,100 |
| 2020 | $2,755 | $29,700 | $7,390 | $22,310 |
| 2019 | $2,765 | $29,700 | $7,390 | $22,310 |
| 2018 | $2,381 | $25,190 | $6,480 | $18,710 |
| 2017 | $2,168 | $25,190 | $6,480 | $18,710 |
| 2016 | $1,897 | $21,640 | $5,900 | $15,740 |
| 2015 | $969 | $21,640 | $5,900 | $15,740 |
| 2014 | $1,671 | $17,230 | $6,130 | $11,100 |
Source: Public Records
Map
Nearby Homes
- 5322 Shetland Ct
- 9224 Weeping Willow Place
- 6 Abernathy Ct
- 9222 Buttonhill Ct
- 14 Stonehaven Ct
- 5055 Weeping Willow Cir
- 5126 Tuscany Ct
- 41 Canongate Ln
- 9382 Morning Glory Ln
- 8951 Greenwich St
- 4927 Greenwich Way
- 6340 Ashburn Ln
- 5329 Morning Glory Place
- 6428 Silver Mesa Dr Unit C
- 8766 Cresthill Ln
- 6418 Silver Mesa Dr Unit C
- 8925 Copeland St
- 9678 Rockhampton Way
- 9254 Lark Sparrow Dr
- 8734 Pochard St
- 9222 Weeping Willow Ct
- 9172 Weeping Willow Ct
- 9162 Weeping Willow Ct
- 9204 Weeping Willow Place
- 9152 Weeping Willow Ct
- 9214 Weeping Willow Place
- 9211 Weeping Willow Ct
- 9221 Weeping Willow Ct
- 9201 Weeping Willow Ct
- 9142 Weeping Willow Ct
- 9231 Weeping Willow Ct
- 9191 Weeping Willow Ct
- 9181 Weeping Willow Ct
- 9241 Weeping Willow Ct
- 9132 Weeping Willow Ct
- 9151 Weeping Willow Ct
- 9171 Weeping Willow Ct
- 9141 Weeping Willow Ct
- 9251 Weeping Willow Ct
- 9122 Weeping Willow Ct