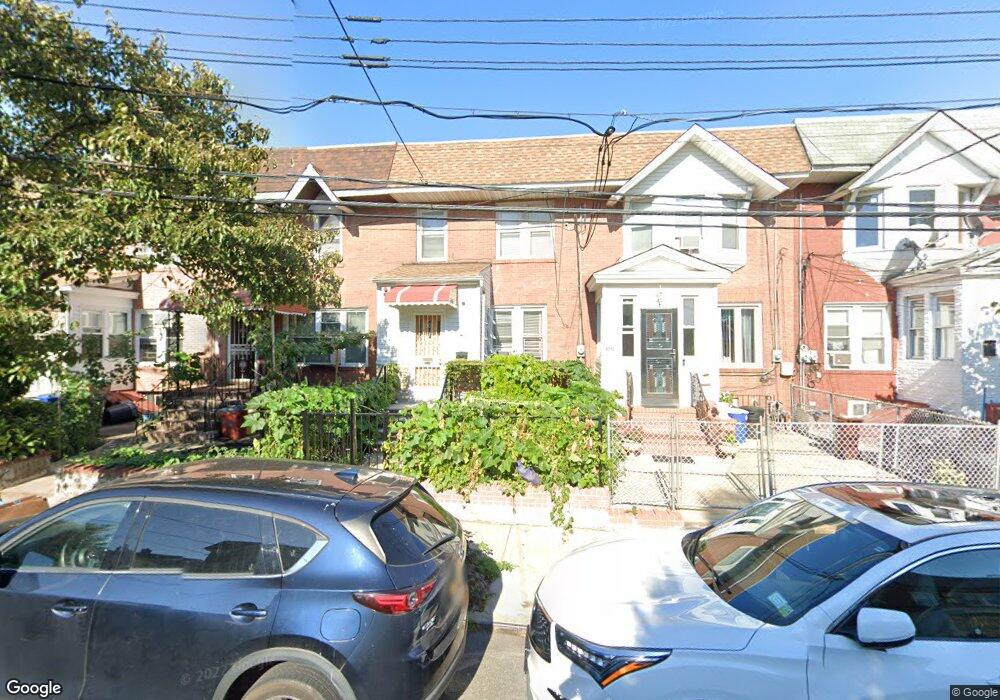
9213 95th St Woodhaven, NY 11421
Woodhaven NeighborhoodEstimated Value: $676,000 - $750,000
--
Bed
--
Bath
1,361
Sq Ft
$523/Sq Ft
Est. Value
About This Home
This home is located at 9213 95th St, Woodhaven, NY 11421 and is currently estimated at $711,921, approximately $523 per square foot. 9213 95th St is a home located in Queens County with nearby schools including P.S. 273, Jhs 210 Elizabeth Blackwell, and Richmond Hill High School.
Ownership History
Date
Name
Owned For
Owner Type
Purchase Details
Closed on
Mar 7, 2022
Sold by
Guan Bella Bizhen and Guan Mei Xian
Bought by
Guan Peng Fei
Current Estimated Value
Purchase Details
Closed on
Nov 14, 2013
Sold by
Moloney Angela
Bought by
Guan Bella Bizhen and Guan Mei Xian
Home Financials for this Owner
Home Financials are based on the most recent Mortgage that was taken out on this home.
Original Mortgage
$230,000
Outstanding Balance
$171,930
Interest Rate
4.29%
Mortgage Type
New Conventional
Estimated Equity
$539,991
Purchase Details
Closed on
Aug 22, 2007
Sold by
Moloney James
Bought by
Moloney Angela
Create a Home Valuation Report for This Property
The Home Valuation Report is an in-depth analysis detailing your home's value as well as a comparison with similar homes in the area
Home Values in the Area
Average Home Value in this Area
Purchase History
| Date | Buyer | Sale Price | Title Company |
|---|---|---|---|
| Guan Peng Fei | -- | -- | |
| Guan Bella Bizhen | $385,000 | -- | |
| Moloney Angela | -- | -- |
Source: Public Records
Mortgage History
| Date | Status | Borrower | Loan Amount |
|---|---|---|---|
| Open | Guan Bella Bizhen | $230,000 |
Source: Public Records
Tax History Compared to Growth
Tax History
| Year | Tax Paid | Tax Assessment Tax Assessment Total Assessment is a certain percentage of the fair market value that is determined by local assessors to be the total taxable value of land and additions on the property. | Land | Improvement |
|---|---|---|---|---|
| 2025 | $5,699 | $30,025 | $7,800 | $22,225 |
| 2024 | $5,699 | $28,373 | $7,777 | $20,596 |
| 2023 | $5,623 | $27,996 | $8,441 | $19,555 |
| 2022 | $4,995 | $40,800 | $11,940 | $28,860 |
| 2021 | $5,437 | $38,520 | $11,940 | $26,580 |
| 2020 | $5,296 | $33,120 | $11,940 | $21,180 |
| 2019 | $4,946 | $35,040 | $11,940 | $23,100 |
| 2018 | $4,756 | $23,330 | $8,860 | $14,470 |
| 2017 | $4,487 | $22,011 | $9,440 | $12,571 |
| 2016 | $4,304 | $22,011 | $9,440 | $12,571 |
| 2015 | $2,285 | $20,851 | $12,729 | $8,122 |
| 2014 | $2,285 | $19,704 | $13,236 | $6,468 |
Source: Public Records
Map
Nearby Homes