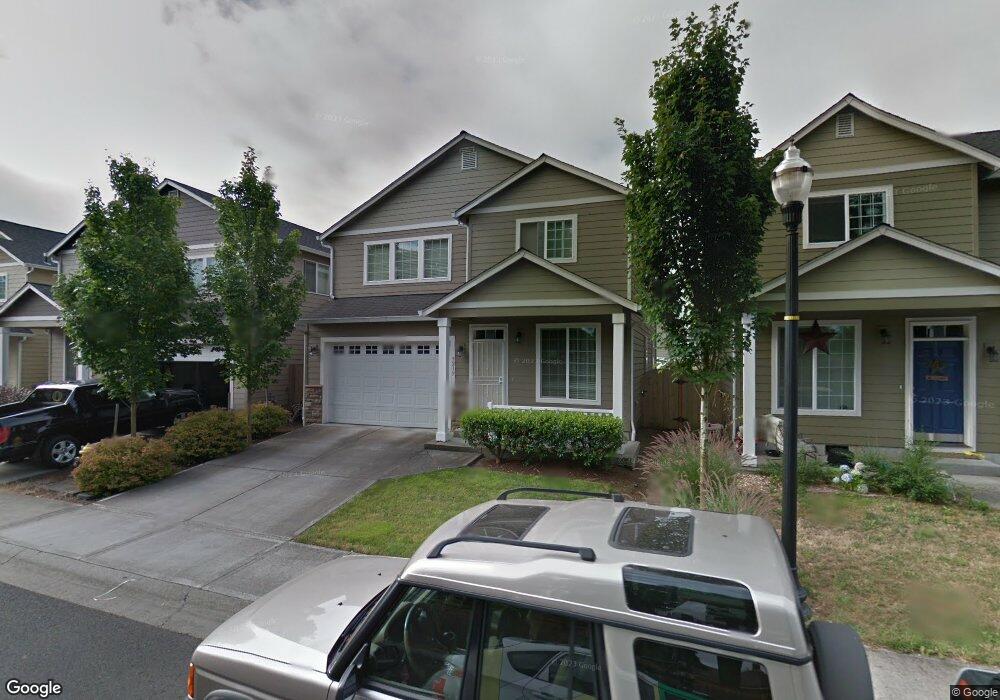
9213 NE 81st Loop Vancouver, WA 98662
Estimated Value: $497,000 - $536,000
4
Beds
3
Baths
2,130
Sq Ft
$240/Sq Ft
Est. Value
About This Home
This home is located at 9213 NE 81st Loop, Vancouver, WA 98662 and is currently estimated at $510,666, approximately $239 per square foot. 9213 NE 81st Loop is a home located in Clark County with nearby schools including Sunset Elementary School, Covington Middle School, and Heritage High School.
Ownership History
Date
Name
Owned For
Owner Type
Purchase Details
Closed on
Dec 2, 2016
Sold by
Himes Jack N and Ahpuck Darcy J
Bought by
Evans Ryan and Maynes Courtenay
Current Estimated Value
Home Financials for this Owner
Home Financials are based on the most recent Mortgage that was taken out on this home.
Original Mortgage
$273,600
Outstanding Balance
$220,927
Interest Rate
3.52%
Mortgage Type
New Conventional
Estimated Equity
$289,739
Purchase Details
Closed on
Jun 14, 2006
Sold by
Rockford Homes Inc
Bought by
Himes Jack N and Ahpuck Darcy J
Purchase Details
Closed on
Mar 2, 2006
Sold by
Eversun Llc
Bought by
Rockford Homes Inc
Home Financials for this Owner
Home Financials are based on the most recent Mortgage that was taken out on this home.
Original Mortgage
$240,716
Interest Rate
6.04%
Mortgage Type
Purchase Money Mortgage
Create a Home Valuation Report for This Property
The Home Valuation Report is an in-depth analysis detailing your home's value as well as a comparison with similar homes in the area
Purchase History
| Date | Buyer | Sale Price | Title Company |
|---|---|---|---|
| Evans Ryan | $288,000 | Fidelity Title Dt Vancouver | |
| Himes Jack N | $304,689 | First American Title | |
| Rockford Homes Inc | $82,107 | First American Title |
Source: Public Records
Mortgage History
| Date | Status | Borrower | Loan Amount |
|---|---|---|---|
| Open | Evans Ryan | $273,600 | |
| Previous Owner | Rockford Homes Inc | $240,716 |
Source: Public Records
Tax History
| Year | Tax Paid | Tax Assessment Tax Assessment Total Assessment is a certain percentage of the fair market value that is determined by local assessors to be the total taxable value of land and additions on the property. | Land | Improvement |
|---|---|---|---|---|
| 2025 | $4,690 | $459,989 | $145,200 | $314,789 |
| 2024 | $4,546 | $461,608 | $145,200 | $316,408 |
| 2023 | $4,454 | $469,684 | $145,200 | $324,484 |
| 2022 | $4,027 | $453,026 | $145,200 | $307,826 |
| 2021 | $3,824 | $381,289 | $123,200 | $258,089 |
| 2020 | $3,577 | $340,507 | $110,000 | $230,507 |
| 2019 | $3,206 | $319,560 | $104,500 | $215,060 |
| 2018 | $3,551 | $308,981 | $0 | $0 |
| 2017 | $3,244 | $276,690 | $0 | $0 |
| 2016 | $3,025 | $263,913 | $0 | $0 |
Source: Public Records
Map
Nearby Homes
- 9217 NE 81st Loop
- 9313 NE 82nd Cir
- 7909 NE 91st Ave
- 8907 NE 84th St
- 9206 NE 75th St
- 8912 NE 71st St
- 7610 NE Meadows Dr
- 8610 NE 70th Cir
- 6808 NE 92nd Ct
- 8605 NE 70th Cir
- 8111 NE 88th St
- 7109 NE 83rd Ave
- 9111 NE 84th Ct
- 8305 NE 71st St
- 10205 NE 69th St
- 10112 NE 67th St
- 10816 NE 77th Cir
- 10703 NE 70th St
- 9405 NE 81st Ave
- 9405 NE 102nd St
- 9209 NE 81st Lp
- 9209 NE 81st Loop
- 9205 NE 81st Loop
- 9303 NE 81st Loop
- 9212 NE 81st St
- 9208 NE 81st St
- 9216 NE 81st St
- 9201 NE 81st Loop
- 9204 NE 81st St
- 9307 NE 81st Loop
- 9304 NE 81st St
- 9200 NE 81st St
- 9311 NE 81st Loop
- 9219 NE 81st Way
- 9111 NE 81st Loop
- 9308 NE 81st St
- 9106 NE 81st St
- 9315 NE 81st Loop
- 9307 NE 81st Way
Your Personal Tour Guide
Ask me questions while you tour the home.