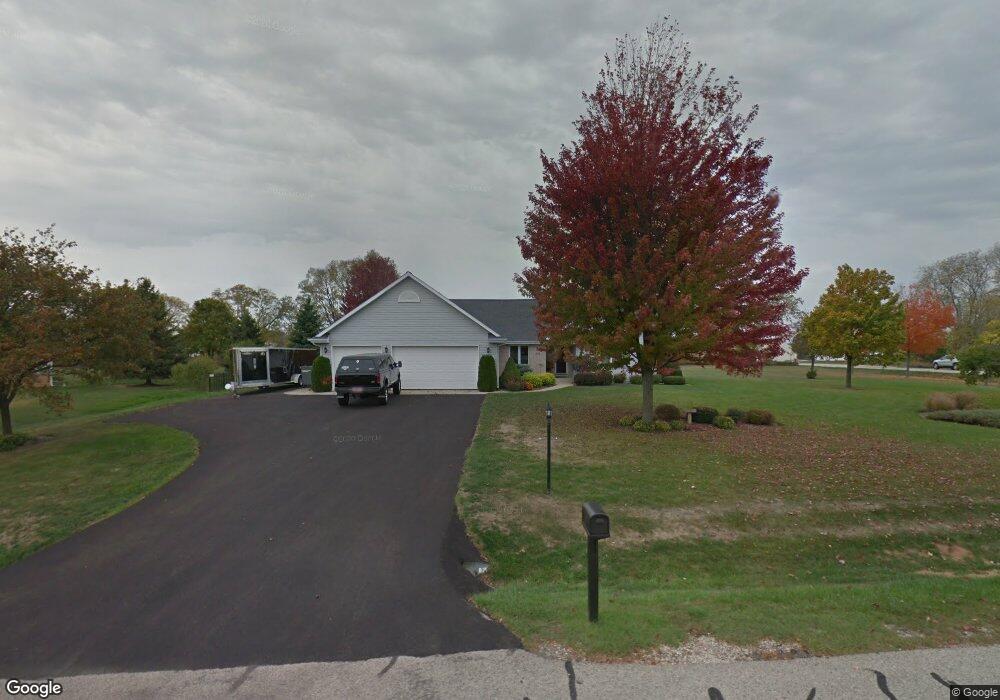
9215 Anthony Ln Spring Grove, IL 60081
Estimated Value: $394,906 - $444,000
Studio
--
Bath
1,900
Sq Ft
$220/Sq Ft
Est. Value
About This Home
This home is located at 9215 Anthony Ln, Spring Grove, IL 60081 and is currently estimated at $418,477, approximately $220 per square foot. 9215 Anthony Ln is a home located in McHenry County with nearby schools including Richmond Grade School, Nippersink Middle School, and Richmond-Burton High School.
Ownership History
Date
Name
Owned For
Owner Type
Purchase Details
Closed on
Nov 15, 2004
Sold by
Luksta Virginia
Bought by
Mlyniec Jeffery J and Mlyniec Terri L
Current Estimated Value
Home Financials for this Owner
Home Financials are based on the most recent Mortgage that was taken out on this home.
Original Mortgage
$225,000
Interest Rate
5.82%
Mortgage Type
Seller Take Back
Purchase Details
Closed on
Jul 25, 2003
Sold by
Chicago Title Land Trust Co
Bought by
Luksta Virginia and The Virginia Luksta Trust
Purchase Details
Closed on
Feb 22, 1996
Sold by
Erkenswick Theresa L
Bought by
Schuelke David F
Purchase Details
Closed on
Sep 15, 1994
Sold by
Mchenry State Bank
Bought by
Erkenswick Theresa
Create a Home Valuation Report for This Property
The Home Valuation Report is an in-depth analysis detailing your home's value as well as a comparison with similar homes in the area
Home Values in the Area
Average Home Value in this Area
Purchase History
| Date | Buyer | Sale Price | Title Company |
|---|---|---|---|
| Mlyniec Jeffery J | $275,000 | St | |
| Luksta Virginia | -- | Chicago Title Land Trust Co | |
| Schuelke David F | $40,000 | Northern Land Title Corp | |
| Erkenswick Theresa | $36,000 | Northern Land Title Corp |
Source: Public Records
Mortgage History
| Date | Status | Borrower | Loan Amount |
|---|---|---|---|
| Previous Owner | Mlyniec Jeffery J | $225,000 |
Source: Public Records
Tax History
| Year | Tax Paid | Tax Assessment Tax Assessment Total Assessment is a certain percentage of the fair market value that is determined by local assessors to be the total taxable value of land and additions on the property. | Land | Improvement |
|---|---|---|---|---|
| 2024 | $8,641 | $123,049 | $21,072 | $101,977 |
| 2023 | $8,581 | $114,763 | $19,653 | $95,110 |
| 2022 | $8,085 | $100,953 | $17,288 | $83,665 |
| 2021 | $7,680 | $95,167 | $16,297 | $78,870 |
| 2020 | $7,506 | $90,973 | $15,579 | $75,394 |
| 2019 | $7,554 | $89,558 | $15,337 | $74,221 |
| 2018 | $7,705 | $86,790 | $14,863 | $71,927 |
| 2017 | $7,594 | $81,500 | $13,957 | $67,543 |
| 2016 | $7,622 | $77,834 | $13,329 | $64,505 |
| 2013 | -- | $75,081 | $14,208 | $60,873 |
Source: Public Records
Map
Nearby Homes
- 8610 Steeple Ln
- 8501 Country Shire Ln
- 1914 Spring Dale Dr
- 8300 Appaloosa Ln
- 7822 N Pillow Hill Rd
- 7830 N Pillow Hill Rd
- 2102 W Hunters Ln
- 9436 Bellaire Ln
- Lot 65,66,&64 Main Street Rd
- Lot 56 & 57 Beverly Way
- Lot 58 & 59 Beverly Way
- Lot 60 & 61 Beverly Way
- 2214 Main Street Rd
- 8002 Morgan Cir
- 11106 Siedschlag Rd
- 1410 Linden Rd
- 7503 Windsor Ave
- 10905 Breezy Lawn Rd
- 535 Deer Run
- LOT 9 Mayo Ct
- 9209 Anthony Ln
- 9210 Carol Ln
- 9303 Anthony Ln
- 9214 Anthony Ln
- 9203 Anthony Ln
- 9206 Carol Ln
- 9208 Anthony Ln
- 1102 Wilmot Farms Dr
- 9304 Anthony Ln
- 1106 Wilmot Farms Dr
- 9202 Carol Ln
- 9306 Anthony Ln
- 9117 Anthony Ln
- 1110 Wilmot Farms Dr
- 9311 Anthony Ln
- 9207 Carol Ln
- 9107 Nicholas Ln
- 9217 Nicholas Ln
- 9211 Carol Ln
- 9112 Carol Ln
Your Personal Tour Guide
Ask me questions while you tour the home.