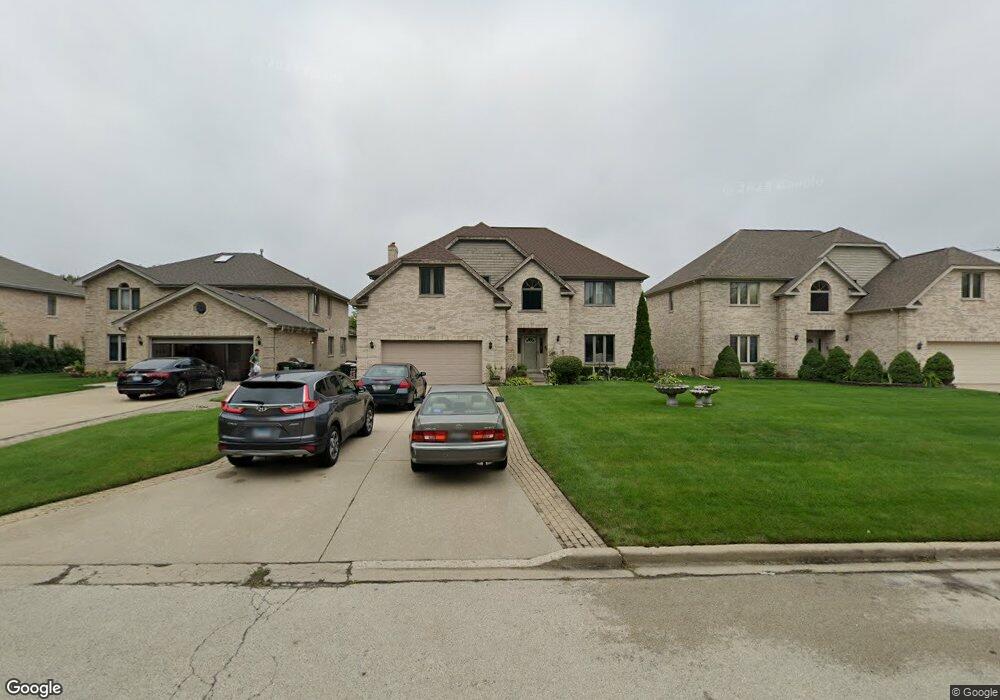
9216 N Ashland Ave Niles, IL 60714
Courtland Park NeighborhoodEstimated Value: $849,565 - $963,000
4
Beds
3
Baths
3,237
Sq Ft
$286/Sq Ft
Est. Value
About This Home
This home is located at 9216 N Ashland Ave, Niles, IL 60714 and is currently estimated at $927,391, approximately $286 per square foot. 9216 N Ashland Ave is a home located in Cook County with nearby schools including Washington Elementary School, Gemini Middle School, and Maine East High School.
Ownership History
Date
Name
Owned For
Owner Type
Purchase Details
Closed on
Sep 29, 2003
Sold by
Thomas Andrew P and Thomas Tessy P
Bought by
Gandhi Vasant Kumar and Gandhi Kalpana
Current Estimated Value
Home Financials for this Owner
Home Financials are based on the most recent Mortgage that was taken out on this home.
Original Mortgage
$487,500
Interest Rate
6.43%
Mortgage Type
Unknown
Purchase Details
Closed on
Oct 27, 1999
Sold by
Zieba Zdzislaw and Zieba Aleksandra
Bought by
Thomas Andrew P and Thomas Tessy P
Home Financials for this Owner
Home Financials are based on the most recent Mortgage that was taken out on this home.
Original Mortgage
$365,000
Interest Rate
7.62%
Purchase Details
Closed on
Jan 30, 1998
Sold by
Sen Bogdan and Sen Alina
Bought by
Zieba Zdzislaw and Zieba Aleksandra
Home Financials for this Owner
Home Financials are based on the most recent Mortgage that was taken out on this home.
Original Mortgage
$240,000
Interest Rate
6.87%
Purchase Details
Closed on
May 5, 1997
Sold by
Sen Bogdan and Sen Alina
Bought by
Sen Bogdan and Sen Alina
Purchase Details
Closed on
Jan 7, 1997
Sold by
Wilke Donna D and Jahns Donald
Bought by
Sen Bogdan and Sen Alina
Create a Home Valuation Report for This Property
The Home Valuation Report is an in-depth analysis detailing your home's value as well as a comparison with similar homes in the area
Home Values in the Area
Average Home Value in this Area
Purchase History
| Date | Buyer | Sale Price | Title Company |
|---|---|---|---|
| Gandhi Vasant Kumar | $650,000 | Rtc | |
| Thomas Andrew P | $510,000 | Professional National Title | |
| Zieba Zdzislaw | $417,000 | -- | |
| Sen Bogdan | -- | -- | |
| Sen Bogdan | $241,000 | -- |
Source: Public Records
Mortgage History
| Date | Status | Borrower | Loan Amount |
|---|---|---|---|
| Closed | Gandhi Vasant Kumar | $487,500 | |
| Previous Owner | Thomas Andrew P | $365,000 | |
| Previous Owner | Zieba Zdzislaw | $240,000 |
Source: Public Records
Tax History Compared to Growth
Tax History
| Year | Tax Paid | Tax Assessment Tax Assessment Total Assessment is a certain percentage of the fair market value that is determined by local assessors to be the total taxable value of land and additions on the property. | Land | Improvement |
|---|---|---|---|---|
| 2024 | $15,120 | $57,065 | $12,330 | $44,735 |
| 2023 | $14,176 | $62,000 | $12,330 | $49,670 |
| 2022 | $14,176 | $62,000 | $12,330 | $49,670 |
| 2021 | $12,151 | $45,204 | $10,568 | $34,636 |
| 2020 | $11,553 | $45,204 | $10,568 | $34,636 |
| 2019 | $13,932 | $61,249 | $10,568 | $50,681 |
| 2018 | $13,182 | $52,864 | $9,100 | $43,764 |
| 2017 | $13,068 | $52,864 | $9,100 | $43,764 |
| 2016 | $13,936 | $59,057 | $9,100 | $49,957 |
| 2015 | $12,979 | $50,875 | $7,632 | $43,243 |
| 2014 | $12,536 | $50,875 | $7,632 | $43,243 |
| 2013 | $12,295 | $50,875 | $7,632 | $43,243 |
Source: Public Records
Map
Nearby Homes
- 9270 N Courtland Dr
- 9246 N Courtland Dr
- 8015 W Church St
- 7948 Beckwith Rd
- 8000 W Foster Ln Unit B208
- 8100 W Foster Ln Unit C410
- 8101 W Courte Dr Unit D307
- 7901 W Park Ave
- 9216 Ozark St
- 8909 N Washington St Unit E
- 8906 N Wisner St
- 7803 Churchill St
- 8313 W Ballard Rd
- 9056 N Clifton Ave
- 2751 Pauline Ave
- 7701 Lake St
- 8819 N Wisner St
- 8802 N Prospect St
- 8803 N Grand St
- 9049 N Greenwood Ave
- 9214 N Ashland Ave
- 9220 N Ashland Ave
- 9212 N Ashland Ave
- 9275 N Woodland Dr
- 9279 N Woodland Dr
- 9277 N Woodland Dr
- 9210 N Ashland Ave
- 9281 N Woodland Dr
- 9283 N Woodland Dr
- 9237 N Willow Ln
- 9215 N Ashland Ave
- 8037 W Lyons St
- 8037 W Lyons St
- 8037 W Lyons St
- 8037 W Lyons St
- 8037 W Lyons St Unit D
- 8037 W Lyons St Unit B
- 9285 N Woodland Dr
- 9270 N Woodland Dr
- 9268 N Woodland Dr