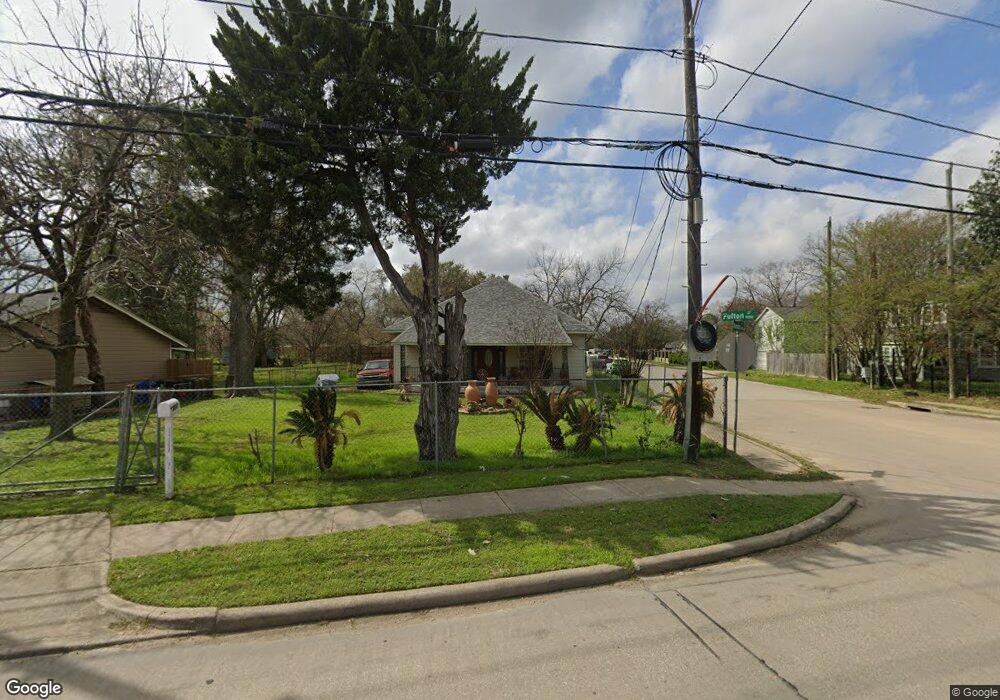
9217 Fulton St Houston, TX 77022
Northside-Northline NeighborhoodEstimated Value: $279,000 - $341,000
2
Beds
1
Bath
1,804
Sq Ft
$171/Sq Ft
Est. Value
About This Home
This home is located at 9217 Fulton St, Houston, TX 77022 and is currently estimated at $309,219, approximately $171 per square foot. 9217 Fulton St is a home located in Harris County with nearby schools including Burbank Elementary School, Burbank Middle School, and Sam Houston Math, Science & Technology Center.
Ownership History
Date
Name
Owned For
Owner Type
Purchase Details
Closed on
Jul 21, 1998
Sold by
Salas Bonifacio C and Orrego Teresa
Bought by
Rodriguez Pascual P and Rodriguez Marie Delosangeles
Current Estimated Value
Home Financials for this Owner
Home Financials are based on the most recent Mortgage that was taken out on this home.
Original Mortgage
$58,000
Interest Rate
8.31%
Purchase Details
Closed on
Jul 20, 1998
Sold by
Orrego Teresa
Bought by
Salas Bonifacio C
Home Financials for this Owner
Home Financials are based on the most recent Mortgage that was taken out on this home.
Original Mortgage
$58,000
Interest Rate
8.31%
Purchase Details
Closed on
May 29, 1996
Sold by
Ofarrell Genevieve and Muir Cora Lee
Bought by
Salas Benifacio C and Orrego Teresa
Create a Home Valuation Report for This Property
The Home Valuation Report is an in-depth analysis detailing your home's value as well as a comparison with similar homes in the area
Home Values in the Area
Average Home Value in this Area
Purchase History
| Date | Buyer | Sale Price | Title Company |
|---|---|---|---|
| Rodriguez Pascual P | $73,000 | -- | |
| Salas Bonifacio C | -- | -- | |
| Salas Bonifacio C | -- | -- | |
| Salas Benifacio C | $32,000 | -- |
Source: Public Records
Mortgage History
| Date | Status | Borrower | Loan Amount |
|---|---|---|---|
| Previous Owner | Rodriguez Pascual P | $58,000 |
Source: Public Records
Tax History Compared to Growth
Tax History
| Year | Tax Paid | Tax Assessment Tax Assessment Total Assessment is a certain percentage of the fair market value that is determined by local assessors to be the total taxable value of land and additions on the property. | Land | Improvement |
|---|---|---|---|---|
| 2025 | $48 | $316,570 | $150,728 | $165,842 |
| 2024 | $48 | $316,570 | $150,728 | $165,842 |
| 2023 | $30 | $290,871 | $150,728 | $140,143 |
| 2022 | $4,048 | $231,353 | $114,840 | $116,513 |
| 2021 | $3,895 | $203,613 | $114,840 | $88,773 |
| 2020 | $3,679 | $182,473 | $114,840 | $67,633 |
| 2019 | $3,495 | $142,997 | $75,364 | $67,633 |
| 2018 | $648 | $125,561 | $75,364 | $50,197 |
| 2017 | $3,175 | $125,561 | $75,364 | $50,197 |
| 2016 | $3,139 | $124,130 | $75,364 | $48,766 |
| 2015 | $2,253 | $117,666 | $75,364 | $42,302 |
| 2014 | $2,253 | $117,666 | $75,364 | $42,302 |
Source: Public Records
Map
Nearby Homes
- 70 Burress St
- 90 Burress St Unit B
- 90 Burress St Unit A
- 9625 Fulton St
- 44 Farrell St
- 61 Trenwood Ln
- 108 Fichter St
- 91 Burbank St
- 110 Luetta St
- 108 Luetta St
- 106 Luetta St
- 104 Luetta St
- 45 Wellford St
- 216 Burress St
- 0 Burbank St Unit 9886770
- 202 Burbank St
- 56 Wellford St
- 249 De Boll St
- 253 De Boll St
- 9816 Fulton St