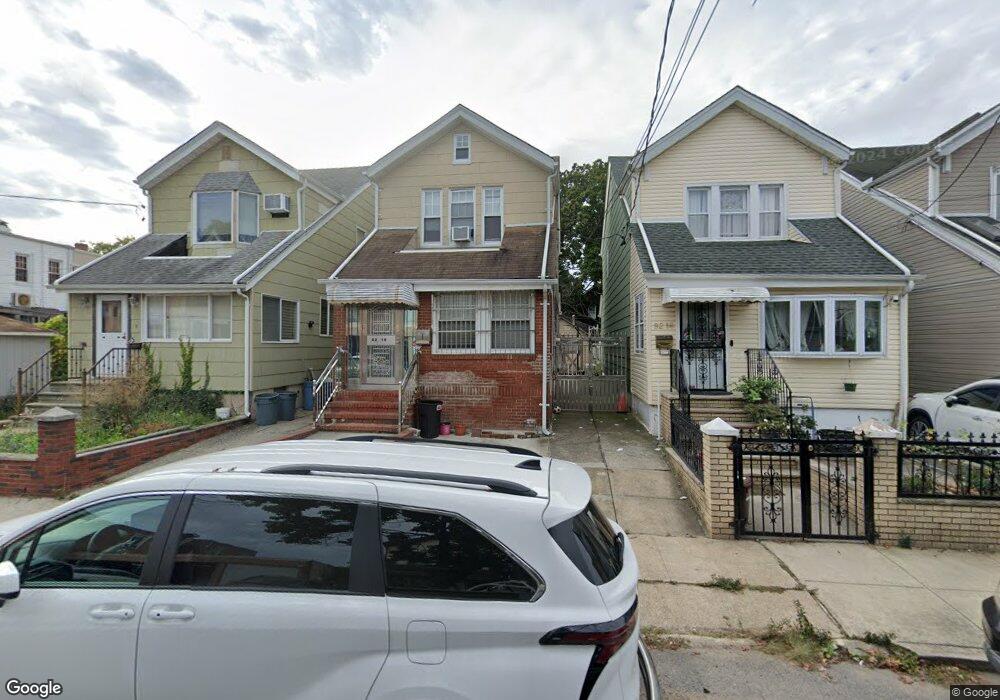
9218 92nd Ave Woodhaven, NY 11421
Woodhaven NeighborhoodEstimated Value: $708,000 - $779,000
--
Bed
--
Bath
1,408
Sq Ft
$528/Sq Ft
Est. Value
About This Home
This home is located at 9218 92nd Ave, Woodhaven, NY 11421 and is currently estimated at $743,052, approximately $527 per square foot. 9218 92nd Ave is a home located in Queens County with nearby schools including New York City Academy For Discovery, Jhs 210 Elizabeth Blackwell, and St. Thomas the Apostle Catholic Academy.
Ownership History
Date
Name
Owned For
Owner Type
Purchase Details
Closed on
Mar 6, 2017
Sold by
Jin Di Wen and Ma Qun
Bought by
Wu Li Qing and Zhang Lai Sheng
Current Estimated Value
Home Financials for this Owner
Home Financials are based on the most recent Mortgage that was taken out on this home.
Original Mortgage
$300,000
Outstanding Balance
$248,638
Interest Rate
4.15%
Mortgage Type
Purchase Money Mortgage
Estimated Equity
$494,414
Purchase Details
Closed on
Nov 4, 2013
Sold by
Cui Larry Zhi Liang and Cui Zhi Hang
Bought by
Jin Di Wen and Ma Qun
Home Financials for this Owner
Home Financials are based on the most recent Mortgage that was taken out on this home.
Original Mortgage
$180,000
Interest Rate
4.25%
Mortgage Type
New Conventional
Purchase Details
Closed on
Jul 20, 2009
Sold by
Cui Jin Qing Lin and Cui Long Zhang
Bought by
Cui Larry Zhi Liang and Cui Zhi Hang
Create a Home Valuation Report for This Property
The Home Valuation Report is an in-depth analysis detailing your home's value as well as a comparison with similar homes in the area
Home Values in the Area
Average Home Value in this Area
Purchase History
| Date | Buyer | Sale Price | Title Company |
|---|---|---|---|
| Wu Li Qing | $500,000 | -- | |
| Jin Di Wen | $390,000 | -- | |
| Cui Larry Zhi Liang | -- | -- |
Source: Public Records
Mortgage History
| Date | Status | Borrower | Loan Amount |
|---|---|---|---|
| Open | Wu Li Qing | $300,000 | |
| Previous Owner | Jin Di Wen | $180,000 |
Source: Public Records
Tax History Compared to Growth
Tax History
| Year | Tax Paid | Tax Assessment Tax Assessment Total Assessment is a certain percentage of the fair market value that is determined by local assessors to be the total taxable value of land and additions on the property. | Land | Improvement |
|---|---|---|---|---|
| 2025 | $5,872 | $29,964 | $8,161 | $21,803 |
| 2024 | $5,872 | $29,237 | $9,128 | $20,109 |
| 2023 | $5,635 | $28,054 | $8,693 | $19,361 |
| 2022 | $5,284 | $37,680 | $12,420 | $25,260 |
| 2021 | $5,255 | $40,080 | $12,420 | $27,660 |
| 2020 | $5,285 | $36,120 | $12,420 | $23,700 |
| 2019 | $5,097 | $33,900 | $12,420 | $21,480 |
| 2018 | $4,766 | $23,378 | $8,358 | $15,020 |
| 2017 | $4,496 | $22,056 | $9,492 | $12,564 |
| 2016 | $2,530 | $22,056 | $9,492 | $12,564 |
| 2015 | -- | $20,808 | $11,730 | $9,078 |
| 2014 | -- | $20,304 | $12,289 | $8,015 |
Source: Public Records
Map
Nearby Homes
- 9220 92nd Ave
- 9218 92nd Ave
- 9216 92nd Ave
- 9206 Woodhaven Blvd
- 9204 Woodhaven Blvd
- 9208 Woodhaven Blvd
- 9214 92nd Ave
- 92-14 92nd Ave
- 9214 92nd Ave
- 9210 Woodhaven Blvd
- 9212 Woodhaven Blvd
- 9202 Woodhaven Blvd
- 9212 92nd Ave
- 9225 93rd Ave
- 9214 Woodhaven Blvd
- 9223 93rd Ave
- 9227 93rd Ave
- 92-25 93rd Ave
- 9219 93rd Ave
- 92-27 93rd Ave