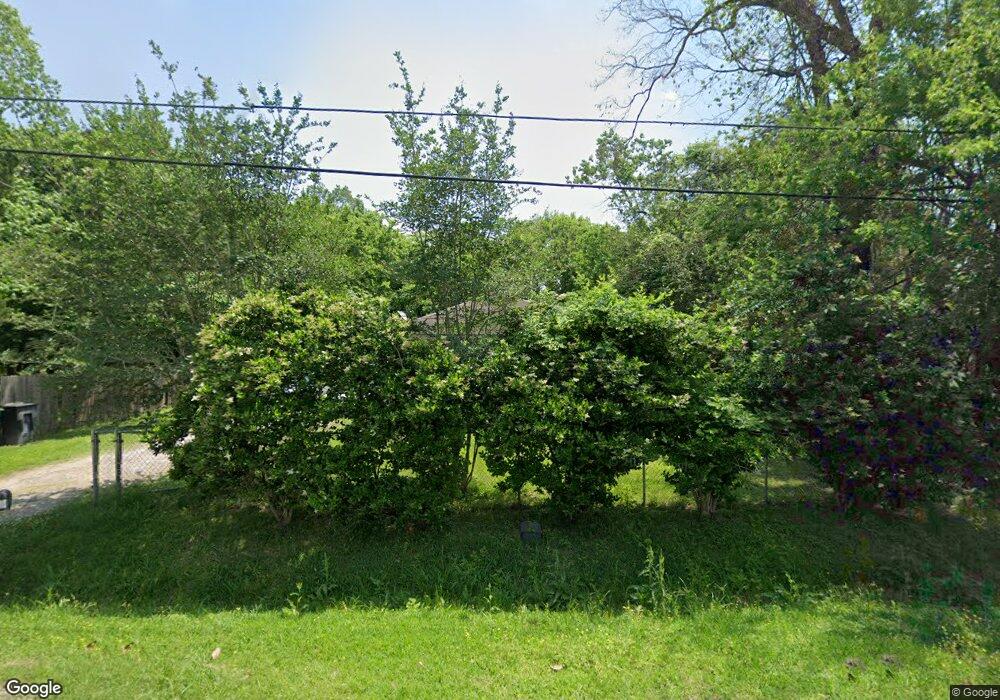
9218 Camay Dr Houston, TX 77016
Trinity-Houston Gardens NeighborhoodEstimated Value: $149,000 - $187,000
2
Beds
1
Bath
1,148
Sq Ft
$144/Sq Ft
Est. Value
About This Home
This home is located at 9218 Camay Dr, Houston, TX 77016 and is currently estimated at $164,898, approximately $143 per square foot. 9218 Camay Dr is a home located in Harris County with nearby schools including Shadydale Elementary School, Forest Brook Middle, and North Forest High School.
Ownership History
Date
Name
Owned For
Owner Type
Purchase Details
Closed on
Sep 3, 2021
Sold by
Webber Sheila R
Bought by
Hilliard Willie E
Current Estimated Value
Home Financials for this Owner
Home Financials are based on the most recent Mortgage that was taken out on this home.
Original Mortgage
$38,000
Outstanding Balance
$34,526
Interest Rate
2.7%
Mortgage Type
Seller Take Back
Estimated Equity
$130,372
Purchase Details
Closed on
Aug 30, 2021
Sold by
Webber Mary
Bought by
Webber Sheila R
Home Financials for this Owner
Home Financials are based on the most recent Mortgage that was taken out on this home.
Original Mortgage
$38,000
Outstanding Balance
$34,526
Interest Rate
2.7%
Mortgage Type
Seller Take Back
Estimated Equity
$130,372
Purchase Details
Closed on
Oct 20, 2010
Sold by
Webber Winston D
Bought by
Webber Sheila R
Create a Home Valuation Report for This Property
The Home Valuation Report is an in-depth analysis detailing your home's value as well as a comparison with similar homes in the area
Home Values in the Area
Average Home Value in this Area
Purchase History
| Date | Buyer | Sale Price | Title Company |
|---|---|---|---|
| Hilliard Willie E | -- | Metropolitan Escrow & Title | |
| Webber Sheila R | -- | Metropolitan Escrow & Ttl Ll | |
| Webber Sheila R | -- | None Available |
Source: Public Records
Mortgage History
| Date | Status | Borrower | Loan Amount |
|---|---|---|---|
| Open | Hilliard Willie E | $38,000 |
Source: Public Records
Tax History Compared to Growth
Tax History
| Year | Tax Paid | Tax Assessment Tax Assessment Total Assessment is a certain percentage of the fair market value that is determined by local assessors to be the total taxable value of land and additions on the property. | Land | Improvement |
|---|---|---|---|---|
| 2025 | $2,197 | $105,000 | $75,188 | $29,812 |
| 2024 | $2,197 | $105,000 | $75,188 | $29,812 |
| 2023 | $2,197 | $113,482 | $56,391 | $57,091 |
| 2022 | $1,902 | $58,000 | $37,594 | $20,406 |
| 2021 | $1,444 | $61,958 | $18,797 | $43,161 |
| 2020 | $1,500 | $61,958 | $18,797 | $43,161 |
| 2019 | $1,568 | $61,958 | $18,797 | $43,161 |
| 2018 | $1,230 | $48,617 | $13,534 | $35,083 |
| 2017 | $1,229 | $48,617 | $13,534 | $35,083 |
| 2016 | $1,229 | $48,617 | $13,534 | $35,083 |
| 2015 | $1,250 | $48,617 | $13,534 | $35,083 |
| 2014 | $1,250 | $48,617 | $13,534 | $35,083 |
Source: Public Records
Map
Nearby Homes
- 8504 Shady Dr
- 9009 Compton St
- 6226 E Tidwell Rd
- 9205 & 9207 Spaulding St
- 5009 Tidwell Rd
- 6110 Tidwell Rd
- 8914 Lanewood Dr
- 6206 Antha St
- 9227 Homestead Rd
- 9317 Homestead Rd
- 9410 Dandy St
- 6415 Laura Koppe Rd
- 9603 Bertwood St
- 8928 Homestead Rd
- 6513 Laura Koppe Rd
- 6320 Laura Koppe Rd
- 9325 Grady St
- 9711 Bertwood St
- 6005 Laura Koppe Rd
- 9118 Sandra St Unit A and B
- 9210 Camay Dr
- 6307 Firnat St
- 9219 Compton St
- 9209 Compton St
- 9205 Compton St
- 9306 Camay Dr
- 9217 Camay Dr
- 9213 Camay Dr
- 9231 Camay Dr
- 9233 Camay Dr
- 6306 Firnat St
- 6302 Firnat St
- 9305 Camay Dr
- 6310 Firnat St
- 6213 Firnat St
- 9318 Camay Dr
- 9327 Camay Dr Unit B
- 9327 Camay Dr Unit A
- 9124 Camay Dr
- 9113 Compton St