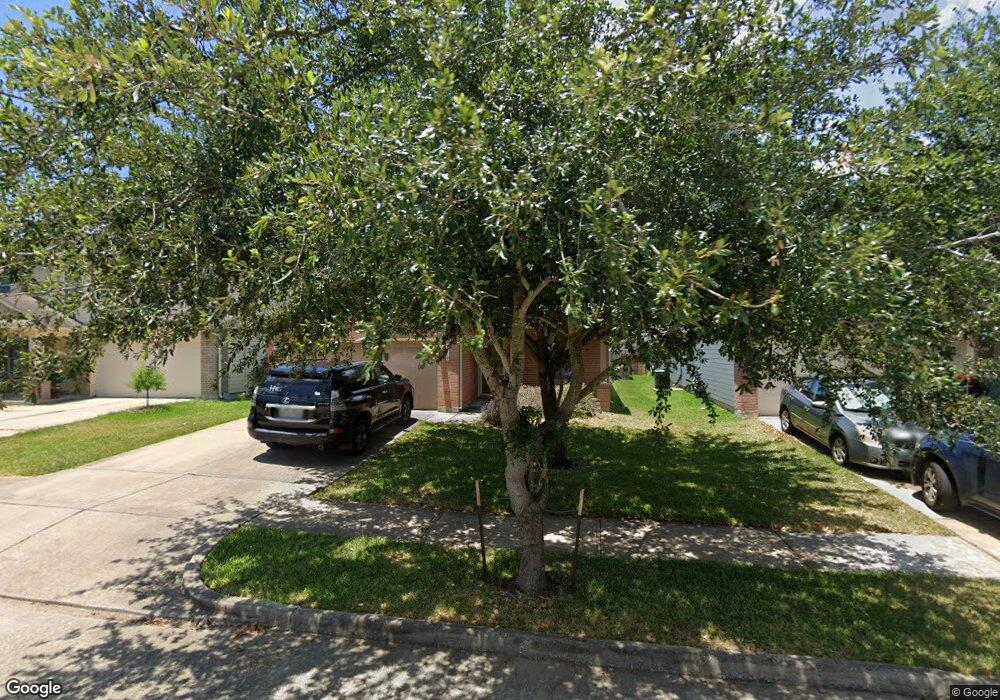
9219 Garfield Park Ln Houston, TX 77075
Southbelt-Ellington NeighborhoodEstimated Value: $230,000 - $261,000
1
Bed
2
Baths
1,405
Sq Ft
$175/Sq Ft
Est. Value
About This Home
This home is located at 9219 Garfield Park Ln, Houston, TX 77075 and is currently estimated at $245,932, approximately $175 per square foot. 9219 Garfield Park Ln is a home located in Harris County with nearby schools including Laura Welch Bush Elementary School, Morris Middle School, and Beverly Hill Intermediate School.
Ownership History
Date
Name
Owned For
Owner Type
Purchase Details
Closed on
Jan 5, 2015
Sold by
Thomas Jesus Ray and Thomas Lauren R
Bought by
Deng Faqian
Current Estimated Value
Home Financials for this Owner
Home Financials are based on the most recent Mortgage that was taken out on this home.
Original Mortgage
$98,000
Interest Rate
4.01%
Mortgage Type
Purchase Money Mortgage
Purchase Details
Closed on
May 9, 2013
Sold by
Thomas Jesus Ray and Tagasa Lauren V
Bought by
Thomas Jesus Ray and Thomas Lauren R
Home Financials for this Owner
Home Financials are based on the most recent Mortgage that was taken out on this home.
Original Mortgage
$123,200
Interest Rate
3.56%
Mortgage Type
New Conventional
Purchase Details
Closed on
Apr 12, 2007
Sold by
Centex Homes
Bought by
Thomas Jesus Ray and Ragasa Lauren
Home Financials for this Owner
Home Financials are based on the most recent Mortgage that was taken out on this home.
Original Mortgage
$130,531
Interest Rate
6.19%
Mortgage Type
Purchase Money Mortgage
Create a Home Valuation Report for This Property
The Home Valuation Report is an in-depth analysis detailing your home's value as well as a comparison with similar homes in the area
Home Values in the Area
Average Home Value in this Area
Purchase History
| Date | Buyer | Sale Price | Title Company |
|---|---|---|---|
| Deng Faqian | -- | None Available | |
| Thomas Jesus Ray | -- | None Available | |
| Thomas Jesus Ray | -- | Commerce Title Co |
Source: Public Records
Mortgage History
| Date | Status | Borrower | Loan Amount |
|---|---|---|---|
| Closed | Deng Faqian | $98,000 | |
| Previous Owner | Thomas Jesus Ray | $123,200 | |
| Previous Owner | Thomas Jesus Ray | $130,531 |
Source: Public Records
Tax History Compared to Growth
Tax History
| Year | Tax Paid | Tax Assessment Tax Assessment Total Assessment is a certain percentage of the fair market value that is determined by local assessors to be the total taxable value of land and additions on the property. | Land | Improvement |
|---|---|---|---|---|
| 2025 | $4,387 | $211,489 | $40,222 | $171,267 |
| 2024 | $4,387 | $220,743 | $40,222 | $180,521 |
| 2023 | $4,387 | $220,743 | $40,222 | $180,521 |
| 2022 | $5,584 | $203,995 | $40,222 | $163,773 |
| 2021 | $5,341 | $169,216 | $35,490 | $133,726 |
| 2020 | $5,323 | $162,738 | $35,490 | $127,248 |
| 2019 | $5,243 | $155,462 | $35,490 | $119,972 |
| 2018 | $1,599 | $138,837 | $30,012 | $108,825 |
| 2017 | $4,483 | $134,452 | $30,012 | $104,440 |
| 2016 | $4,343 | $130,274 | $27,511 | $102,763 |
| 2015 | $3,090 | $120,267 | $25,010 | $95,257 |
| 2014 | $3,090 | $112,170 | $25,010 | $87,160 |
Source: Public Records
Map
Nearby Homes
- 10518 Tenleyton Ln
- 10406 Sutter Glen Ln
- 9319 Canady Park Ln
- 10506 Pleasant Villas Ln
- 0 Fuqua St Unit 64883593
- 0 Fuqua St Unit 45902141
- 0 Fuqua St Unit 97219329
- 7329 Madison Commons Ln
- 7322 Madison Commons Ln
- 9307 Fuqua Ridge Ln
- 10223 Belcamp Ct
- 10307 Collin Park
- 10827 Linden Gate Dr
- 10831 Cayman Mist Dr
- 10918 Linden Gate Dr
- 10858 Shannon Mills Ln
- 10847 Nellsfield Ln
- 9423 Garden Bridge St
- 10934 Bradford Way Dr
- 8706 Danbury Hollow Ln
- 9215 Garfield Park Ln
- 9223 Garfield Park Ln
- 9211 Garfield Park Ln
- 9227 Garfield Park Ln
- 9222 Delmont Park Ln
- 9226 Delmont Park Ln
- 9218 Delmont Park Ln
- 9207 Garfield Park Ln
- 9214 Delmont Park Ln
- 9231 Garfield Park Ln
- 9230 Delmont Park Ln
- 9214 Garfield Park Ln
- 9222 Garfield Park Ln
- 9210 Delmont Park Ln
- 9218 Garfield Park Ln
- 9234 Delmont Park Ln
- 9203 Garfield Park Ln
- 9210 Garfield Park Ln
- 9235 Garfield Park Ln
- 9226 Garfield Park Ln