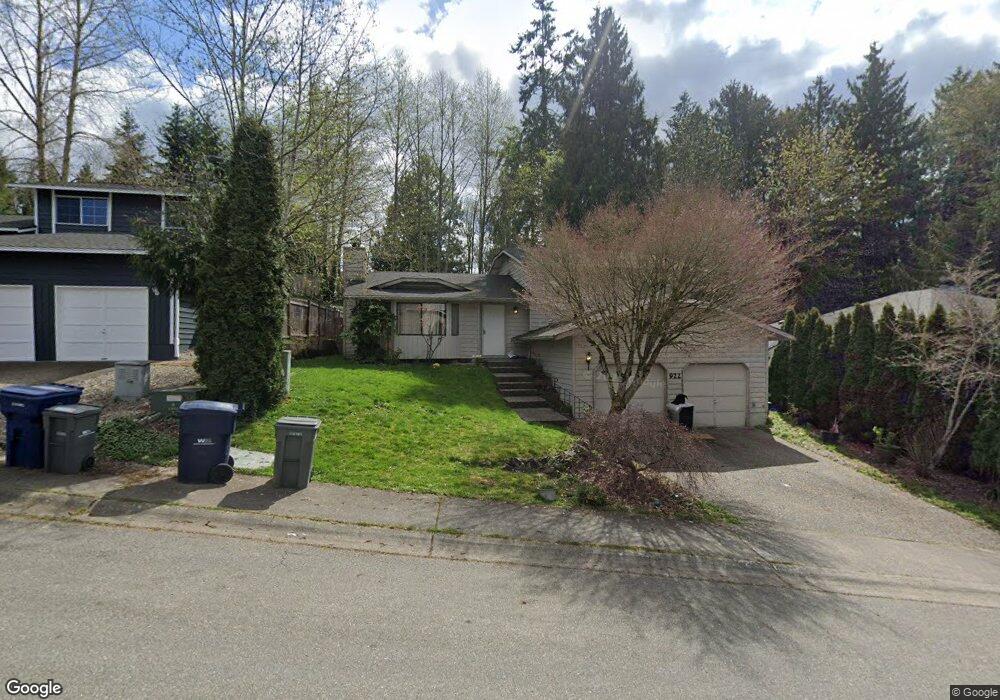
922 214th Place SW Lynnwood, WA 98036
Queensborough-Brentwood NeighborhoodEstimated Value: $733,000 - $838,000
3
Beds
3
Baths
1,503
Sq Ft
$513/Sq Ft
Est. Value
About This Home
This home is located at 922 214th Place SW, Lynnwood, WA 98036 and is currently estimated at $770,493, approximately $512 per square foot. 922 214th Place SW is a home located in Snohomish County with nearby schools including Frank Love Elementary School, Kenmore Middle School, and Bothell High School.
Ownership History
Date
Name
Owned For
Owner Type
Purchase Details
Closed on
Feb 22, 2001
Sold by
Va
Bought by
Saghari Ali A and Saghari Susan C
Current Estimated Value
Home Financials for this Owner
Home Financials are based on the most recent Mortgage that was taken out on this home.
Original Mortgage
$157,200
Outstanding Balance
$56,358
Interest Rate
6.98%
Mortgage Type
VA
Estimated Equity
$714,135
Purchase Details
Closed on
Jun 15, 2000
Sold by
Bank United
Bought by
Va
Purchase Details
Closed on
Jan 15, 1999
Sold by
Baker Hollis Lee
Bought by
Varney Michael Starr
Purchase Details
Closed on
Jul 23, 1996
Sold by
Scarborough Anthony K and Scarborough Ruth A
Bought by
Varney Michael and Baker Hollis
Home Financials for this Owner
Home Financials are based on the most recent Mortgage that was taken out on this home.
Original Mortgage
$165,750
Interest Rate
8.39%
Mortgage Type
VA
Create a Home Valuation Report for This Property
The Home Valuation Report is an in-depth analysis detailing your home's value as well as a comparison with similar homes in the area
Home Values in the Area
Average Home Value in this Area
Purchase History
| Date | Buyer | Sale Price | Title Company |
|---|---|---|---|
| Saghari Ali A | -- | -- | |
| Va | -- | Evergreen Title Company Inc | |
| Bank United | $176,260 | Evergreen Title Company Inc | |
| Varney Michael Starr | -- | First American Title Ins Co | |
| Varney Michael | $162,500 | Chicago Title Ins Co |
Source: Public Records
Mortgage History
| Date | Status | Borrower | Loan Amount |
|---|---|---|---|
| Open | Saghari Ali A | $157,200 | |
| Previous Owner | Varney Michael | $165,750 |
Source: Public Records
Tax History Compared to Growth
Tax History
| Year | Tax Paid | Tax Assessment Tax Assessment Total Assessment is a certain percentage of the fair market value that is determined by local assessors to be the total taxable value of land and additions on the property. | Land | Improvement |
|---|---|---|---|---|
| 2025 | $5,684 | $607,300 | $485,000 | $122,300 |
| 2024 | $5,684 | $663,200 | $545,000 | $118,200 |
| 2023 | $5,973 | $754,800 | $630,000 | $124,800 |
| 2022 | $5,224 | $528,300 | $423,000 | $105,300 |
| 2020 | $4,473 | $406,700 | $311,000 | $95,700 |
| 2019 | $3,806 | $348,000 | $260,000 | $88,000 |
| 2018 | $3,531 | $303,800 | $225,000 | $78,800 |
| 2017 | $2,860 | $246,800 | $175,000 | $71,800 |
| 2016 | $2,707 | $227,500 | $160,000 | $67,500 |
| 2015 | $2,759 | $221,100 | $145,000 | $76,100 |
| 2013 | $2,769 | $197,900 | $124,000 | $73,900 |
Source: Public Records
Map
Nearby Homes
- 604 213th St SW
- 525 218th St SW
- 20914 13th Place W
- 0 Larch Way Unit NWM2427085
- 210 219th Place SW
- 212 xx Cypress Way
- 20901 Cypress Way Unit 16
- 114 212th St SE
- 612 228th St SW Unit K201
- 309 207th Place SE
- 317 207th St SE
- 330 221st St SE
- 1815 201st Place SW
- 738 211th Place SE
- 803 211th Place SE
- 722 211th Place SE
- 721 211th Place SE
- 21911 4th Ave SE
- 22710 2nd Ave SE
- 816 218th St SE
- 926 214th Place SW
- 916 214th Place SW
- 932 214th Place SW
- 910 214th Place SW
- 21510 8th Place W
- 21328 9th Place W
- 21524 8th Place W
- 1006 214th Place SW
- 904 214th Place SW
- 21327 10th Place W
- 21331 9th Place W
- 21318 9th Pl W
- 1012 214th Place SW
- 21514 8th Place W
- 21319 10th Place W
- 902 214th Place SW
- 21516 9th Place W
- 21319 9th Place W
- 21322 10th Place W
- 1018 214th Place SW