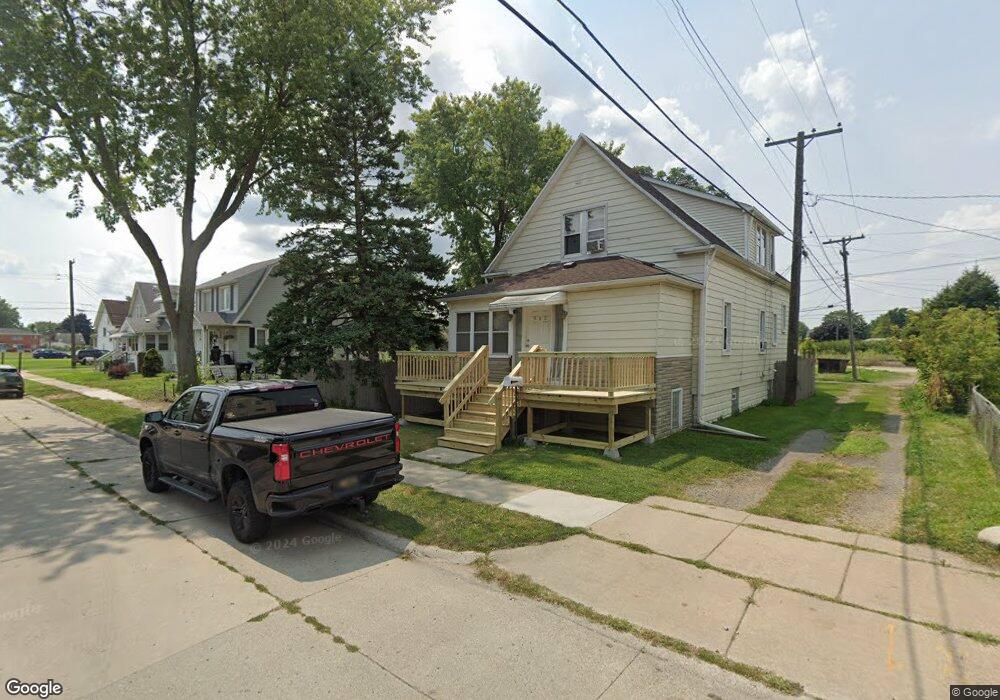
922 3rd St Wyandotte, MI 48192
Estimated Value: $189,000 - $220,000
--
Bed
1
Bath
1,512
Sq Ft
$135/Sq Ft
Est. Value
About This Home
This home is located at 922 3rd St, Wyandotte, MI 48192 and is currently estimated at $204,275, approximately $135 per square foot. 922 3rd St is a home located in Wayne County with nearby schools including James A. Garfield Elementary School, Woodrow Wilson School, and Roosevelt High School.
Ownership History
Date
Name
Owned For
Owner Type
Purchase Details
Closed on
Jun 28, 2016
Sold by
Deutsche Bank National Trust Company
Bought by
Stone Kenneth
Current Estimated Value
Purchase Details
Closed on
Jun 11, 2015
Sold by
Stone Kenneth
Bought by
Deutsche Bank National Trust Company
Purchase Details
Closed on
Aug 1, 2005
Sold by
Hickey Carol L and Maloney Linn L
Bought by
Stone Kenneth
Purchase Details
Closed on
Jul 29, 2005
Sold by
Maloney Patrick Dennis Frederick and Albany Kristen Ann
Bought by
Hickey Carol L
Create a Home Valuation Report for This Property
The Home Valuation Report is an in-depth analysis detailing your home's value as well as a comparison with similar homes in the area
Home Values in the Area
Average Home Value in this Area
Purchase History
| Date | Buyer | Sale Price | Title Company |
|---|---|---|---|
| Stone Kenneth | $60,000 | None Available | |
| Deutsche Bank National Trust Company | $165,196 | Attorney | |
| Stone Kenneth | $116,400 | Multiple | |
| Hickey Carol L | -- | Multiple | |
| Hickey Carol L | -- | Multiple |
Source: Public Records
Tax History Compared to Growth
Tax History
| Year | Tax Paid | Tax Assessment Tax Assessment Total Assessment is a certain percentage of the fair market value that is determined by local assessors to be the total taxable value of land and additions on the property. | Land | Improvement |
|---|---|---|---|---|
| 2025 | $2,054 | $105,500 | $0 | $0 |
| 2024 | $2,054 | $93,700 | $0 | $0 |
| 2023 | $1,959 | $83,800 | $0 | $0 |
| 2022 | $2,269 | $74,600 | $0 | $0 |
| 2021 | $2,224 | $64,300 | $0 | $0 |
| 2020 | $2,193 | $56,100 | $0 | $0 |
| 2019 | $2,363 | $54,600 | $0 | $0 |
| 2018 | $1,726 | $42,400 | $0 | $0 |
| 2017 | $756 | $42,400 | $0 | $0 |
| 2016 | $2,768 | $42,400 | $0 | $0 |
| 2015 | $3,726 | $39,400 | $0 | $0 |
| 2013 | $3,610 | $36,100 | $0 | $0 |
| 2012 | $1,687 | $37,800 | $9,600 | $28,200 |
Source: Public Records
Map
Nearby Homes