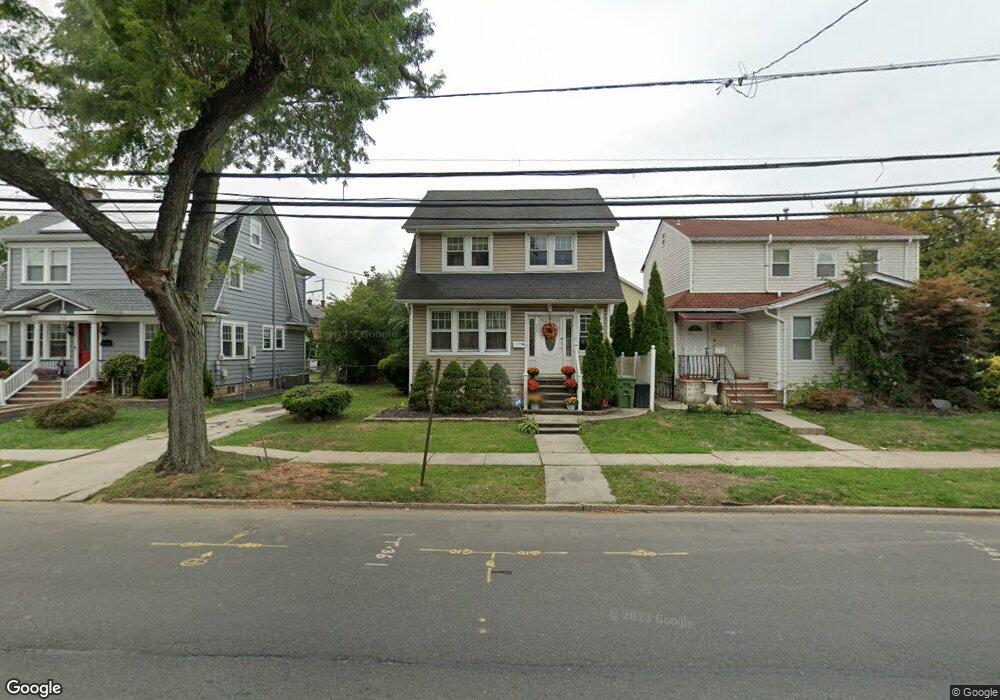
922 Chestnut St Roselle, NJ 07203
Estimated Value: $463,837 - $497,000
4
Beds
2
Baths
1,364
Sq Ft
$352/Sq Ft
Est. Value
About This Home
This home is located at 922 Chestnut St, Roselle, NJ 07203 and is currently estimated at $480,209, approximately $352 per square foot. 922 Chestnut St is a home located in Union County with nearby schools including Dr Charles C Polk School, Leonard V. Moore Middle School, and Grace Wilday Junior High School.
Ownership History
Date
Name
Owned For
Owner Type
Purchase Details
Closed on
Jun 24, 1998
Sold by
Potts Frank and Potts Elizabeth
Bought by
Oglesby Vanessa K
Current Estimated Value
Home Financials for this Owner
Home Financials are based on the most recent Mortgage that was taken out on this home.
Original Mortgage
$76,500
Outstanding Balance
$15,264
Interest Rate
7.02%
Estimated Equity
$464,945
Create a Home Valuation Report for This Property
The Home Valuation Report is an in-depth analysis detailing your home's value as well as a comparison with similar homes in the area
Home Values in the Area
Average Home Value in this Area
Purchase History
| Date | Buyer | Sale Price | Title Company |
|---|---|---|---|
| Oglesby Vanessa K | $85,000 | Chicago Title Insurance Co |
Source: Public Records
Mortgage History
| Date | Status | Borrower | Loan Amount |
|---|---|---|---|
| Open | Oglesby Vanessa K | $76,500 |
Source: Public Records
Tax History Compared to Growth
Tax History
| Year | Tax Paid | Tax Assessment Tax Assessment Total Assessment is a certain percentage of the fair market value that is determined by local assessors to be the total taxable value of land and additions on the property. | Land | Improvement |
|---|---|---|---|---|
| 2025 | $7,678 | $88,300 | $62,000 | $26,300 |
| 2024 | $7,485 | $88,300 | $62,000 | $26,300 |
| 2023 | $7,485 | $88,300 | $62,000 | $26,300 |
| 2022 | $7,537 | $88,300 | $62,000 | $26,300 |
| 2021 | $7,492 | $88,300 | $62,000 | $26,300 |
| 2020 | $7,468 | $88,300 | $62,000 | $26,300 |
| 2019 | $7,373 | $88,300 | $62,000 | $26,300 |
| 2018 | $7,332 | $88,300 | $62,000 | $26,300 |
| 2017 | $8,665 | $104,900 | $62,000 | $42,900 |
| 2016 | $8,474 | $104,900 | $62,000 | $42,900 |
| 2015 | $8,473 | $104,900 | $62,000 | $42,900 |
| 2014 | $8,237 | $104,900 | $62,000 | $42,900 |
Source: Public Records
Map
Nearby Homes