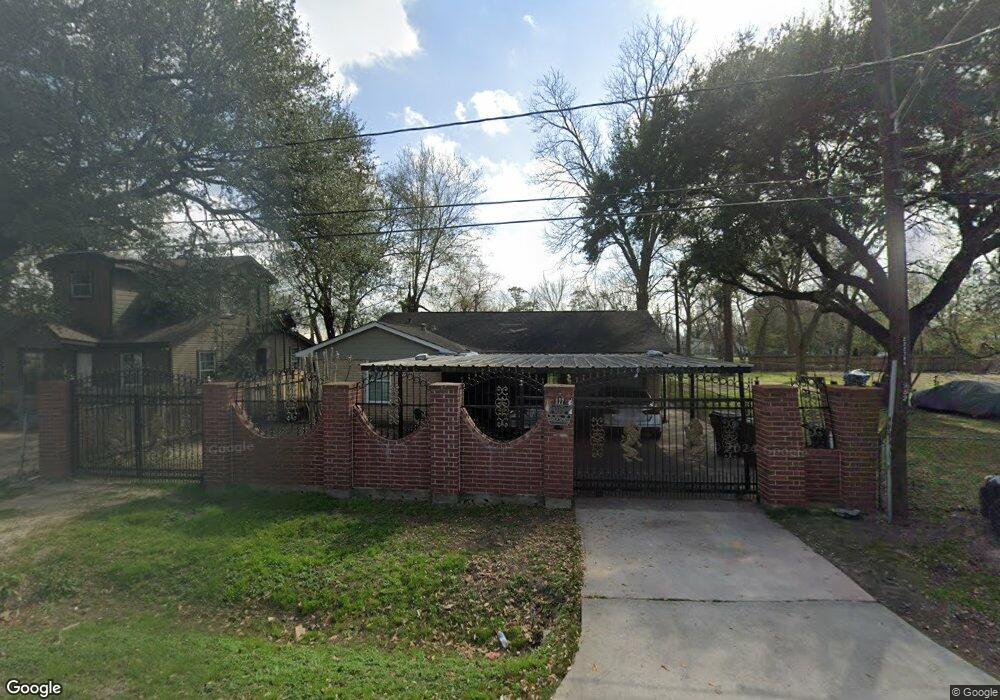
922 De Boll St Houston, TX 77022
Northside-Northline NeighborhoodEstimated Value: $208,491 - $279,000
3
Beds
2
Baths
1,160
Sq Ft
$218/Sq Ft
Est. Value
About This Home
This home is located at 922 De Boll St, Houston, TX 77022 and is currently estimated at $252,373, approximately $217 per square foot. 922 De Boll St is a home located in Harris County with nearby schools including Burbank Elementary School, Burbank Middle School, and Sam Houston Math, Science & Technology Center.
Ownership History
Date
Name
Owned For
Owner Type
Purchase Details
Closed on
Sep 8, 2008
Sold by
Gonzalez Paulino and Gonzalez Maria D
Bought by
Torres Felipe
Current Estimated Value
Home Financials for this Owner
Home Financials are based on the most recent Mortgage that was taken out on this home.
Original Mortgage
$89,250
Interest Rate
5.83%
Mortgage Type
Purchase Money Mortgage
Create a Home Valuation Report for This Property
The Home Valuation Report is an in-depth analysis detailing your home's value as well as a comparison with similar homes in the area
Home Values in the Area
Average Home Value in this Area
Purchase History
| Date | Buyer | Sale Price | Title Company |
|---|---|---|---|
| Torres Felipe | -- | Partners Title Company |
Source: Public Records
Mortgage History
| Date | Status | Borrower | Loan Amount |
|---|---|---|---|
| Previous Owner | Torres Felipe | $89,250 |
Source: Public Records
Tax History Compared to Growth
Tax History
| Year | Tax Paid | Tax Assessment Tax Assessment Total Assessment is a certain percentage of the fair market value that is determined by local assessors to be the total taxable value of land and additions on the property. | Land | Improvement |
|---|---|---|---|---|
| 2025 | $2,219 | $199,931 | $102,600 | $97,331 |
| 2024 | $2,219 | $191,734 | $94,163 | $97,571 |
| 2023 | $2,219 | $210,393 | $57,375 | $153,018 |
| 2022 | $3,350 | $179,370 | $57,375 | $121,995 |
| 2021 | $3,224 | $146,458 | $57,375 | $89,083 |
| 2020 | $3,045 | $136,507 | $57,375 | $79,132 |
| 2019 | $2,893 | $132,619 | $47,250 | $85,369 |
| 2018 | $1,813 | $108,509 | $39,488 | $69,021 |
| 2017 | $2,389 | $108,509 | $39,488 | $69,021 |
| 2016 | $2,172 | $99,095 | $37,125 | $61,970 |
| 2015 | $1,435 | $78,084 | $27,000 | $51,084 |
| 2014 | $1,435 | $78,084 | $27,000 | $51,084 |
Source: Public Records
Map
Nearby Homes
- 807 Firnat St
- 1207 Firnat St
- 723 Doverside St
- 702 Pennington St
- 9026 Mcgallion Rd
- 88 Berry Rd
- 1104 Charnwood St
- 8411 Berry Brush Ln
- 8402 Berry Green Ln
- 318 Charlock St
- 802 Berry Sage Ln
- 411 Berry Rd
- 253 De Boll St
- 249 De Boll St
- 8205 Appleton St
- 216 Burress St
- 631 Apache St
- 743 Apache St
- 415 Briarcliff Dr
- 714 Apache St
- 920 De Boll St
- 924 De Boll St
- 915 De Boll St
- 908 De Boll St
- 9019 Irvington Blvd
- 9011 Irvington Blvd
- 919 De Boll St
- 9101 Irvington Blvd
- 820 De Boll St
- 913 De Boll St
- 903 Firnat St
- 903 Firnat St
- 911 De Boll St
- 923 De Boll St
- 812 1/2 De Boll St
- 821 De Boll St
- 9107 Irvington Blvd Unit 1
- 808 De Boll St
- 826 Hohl St
- 811 Firnat St