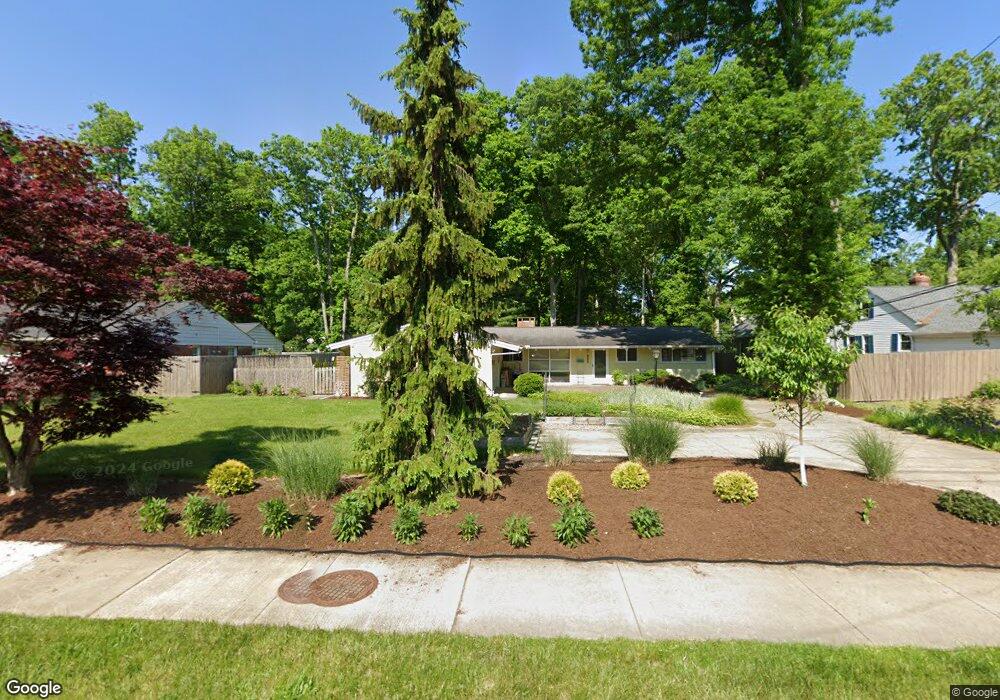
922 Dover Center Rd Westlake, OH 44145
Estimated Value: $281,000 - $335,000
3
Beds
2
Baths
1,938
Sq Ft
$154/Sq Ft
Est. Value
About This Home
This home is located at 922 Dover Center Rd, Westlake, OH 44145 and is currently estimated at $298,759, approximately $154 per square foot. 922 Dover Center Rd is a home located in Cuyahoga County with nearby schools including Westlake Elementary School, Dover Intermediate School, and Lee Burneson Middle School.
Ownership History
Date
Name
Owned For
Owner Type
Purchase Details
Closed on
Mar 19, 2021
Sold by
Shaver Cheryl L
Bought by
Shaver Cheryl L and Evans Brian Scott
Current Estimated Value
Purchase Details
Closed on
Dec 12, 2005
Sold by
Crow Walter C and Crow Barbara Fae
Bought by
Shaver Cheryl L
Home Financials for this Owner
Home Financials are based on the most recent Mortgage that was taken out on this home.
Original Mortgage
$32,800
Interest Rate
6%
Mortgage Type
Unknown
Purchase Details
Closed on
May 26, 1994
Sold by
Crow Walter C
Bought by
Crow Walter C
Purchase Details
Closed on
Dec 1, 1987
Sold by
Benjamin Donald G
Bought by
Crow Walter C
Purchase Details
Closed on
Jun 29, 1984
Sold by
Mcgregor Bruce L and Mcgregor Evelyn H
Bought by
Benjamin Donald G
Purchase Details
Closed on
Jan 1, 1975
Bought by
Mcgregor Bruce L and Mcgregor Evelyn H
Create a Home Valuation Report for This Property
The Home Valuation Report is an in-depth analysis detailing your home's value as well as a comparison with similar homes in the area
Home Values in the Area
Average Home Value in this Area
Purchase History
| Date | Buyer | Sale Price | Title Company |
|---|---|---|---|
| Shaver Cheryl L | -- | Nations Title Agency | |
| Shaver Cheryl L | $164,000 | Real | |
| Crow Walter C | -- | -- | |
| Crow Walter C | $84,000 | -- | |
| Benjamin Donald G | $70,000 | -- | |
| Mcgregor Bruce L | -- | -- |
Source: Public Records
Mortgage History
| Date | Status | Borrower | Loan Amount |
|---|---|---|---|
| Closed | Shaver Cheryl L | $32,800 | |
| Open | Shaver Cheryl L | $131,200 |
Source: Public Records
Tax History Compared to Growth
Tax History
| Year | Tax Paid | Tax Assessment Tax Assessment Total Assessment is a certain percentage of the fair market value that is determined by local assessors to be the total taxable value of land and additions on the property. | Land | Improvement |
|---|---|---|---|---|
| 2024 | $3,494 | $73,745 | $17,360 | $56,385 |
| 2023 | $3,693 | $66,650 | $16,420 | $50,230 |
| 2022 | $3,634 | $66,640 | $16,420 | $50,230 |
| 2021 | $3,639 | $66,640 | $16,420 | $50,230 |
| 2020 | $3,542 | $59,500 | $14,670 | $44,840 |
| 2019 | $3,434 | $170,000 | $41,900 | $128,100 |
| 2018 | $3,143 | $59,500 | $14,670 | $44,840 |
| 2017 | $2,867 | $46,520 | $12,600 | $33,920 |
| 2016 | $2,852 | $46,520 | $12,600 | $33,920 |
| 2015 | $2,714 | $46,520 | $12,600 | $33,920 |
| 2014 | $2,714 | $43,470 | $11,760 | $31,710 |
Source: Public Records
Map
Nearby Homes
- 26927 E Oviatt Rd
- 27841 Birchwood Ct
- 879 S Parkside Dr
- 841 S Parkside Dr
- 1326 Marview Dr
- 27870 Birchwood Ct
- 1528 Dover Center Rd
- 27029 Normandy Rd
- 1359 Marview Dr
- 1455 Mozart Dr
- 26819 Normandy Rd
- 27028 Normandy Rd
- 495 Cahoon Rd
- 1504 Beethoven Dr
- 483 Cahoon Rd
- 481 Cahoon Rd
- 479 Cahoon Rd
- 551 Elmwood Rd
- 477 Cahoon Rd
- 27407 Wolf Rd
- 904 Dover Center Rd
- 934 Dover Center Rd
- 27295 Georgetown Dr
- 27340 Ellington Rd
- 921 Dover Center Rd
- 933 Dover Center Rd
- 903 Dover Center Rd
- 878 Dover Center Rd
- 27311 Georgetown Dr
- 962 Dover Center Rd
- 891 Dover Center Rd
- 27277 Ellington Rd
- 945 Dover Center Rd
- 27360 Ellington Rd
- 27333 Ellington Rd
- 963 Dover Center Rd
- 27294 Georgetown Dr
- 970 Dover Center Rd
- 27329 Georgetown Dr
- 27359 Ellington Rd