Estimated Value: $422,570 - $467,000
4
Beds
2
Baths
2,469
Sq Ft
$183/Sq Ft
Est. Value
About This Home
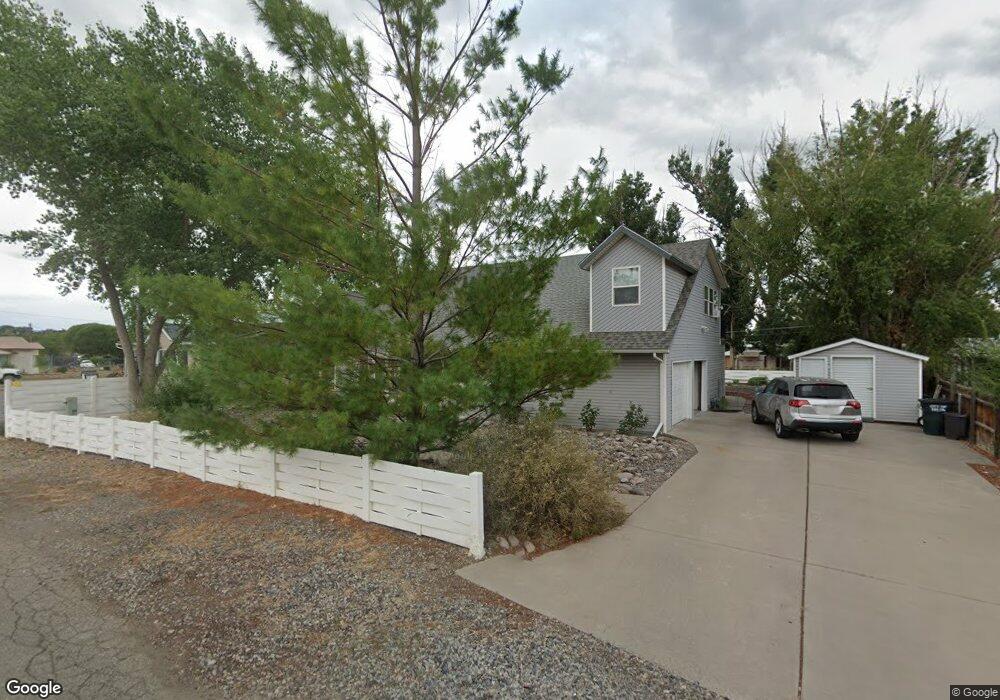
This home is located at 922 E 11th St, Delta, CO 81416 and is currently estimated at $451,643, approximately $182 per square foot. 922 E 11th St is a home located in Delta County with nearby schools including Lincoln Elementary School, Garnet Mesa Elementary School, and Delta Middle School.
Ownership History
Date
Name
Owned For
Owner Type
Purchase Details
Closed on
Sep 29, 2017
Sold by
Mckenney Joyce M
Bought by
Johnson Benjamin and Johnson Roseann
Current Estimated Value
Home Financials for this Owner
Home Financials are based on the most recent Mortgage that was taken out on this home.
Original Mortgage
$220,924
Outstanding Balance
$182,388
Interest Rate
3.75%
Mortgage Type
FHA
Estimated Equity
$269,255
Purchase Details
Closed on
Jan 5, 1996
Sold by
International General Enterprises
Bought by
Mckenney Johnson Benjamin and Mckenney Johnson
Purchase Details
Closed on
May 3, 1993
Sold by
Kjeldgaard
Bought by
Johnson Benjamin and Johnson Leonibus
Create a Home Valuation Report for This Property
The Home Valuation Report is an in-depth analysis detailing your home's value as well as a comparison with similar homes in the area
Purchase History
| Date | Buyer | Sale Price | Title Company |
|---|---|---|---|
| Johnson Benjamin | $225,000 | None Available | |
| Mckenney Johnson Benjamin | $33,800 | -- | |
| Johnson Benjamin | $61,000 | -- |
Source: Public Records
Mortgage History
| Date | Status | Borrower | Loan Amount |
|---|---|---|---|
| Open | Johnson Benjamin | $220,924 |
Source: Public Records
Tax History
| Year | Tax Paid | Tax Assessment Tax Assessment Total Assessment is a certain percentage of the fair market value that is determined by local assessors to be the total taxable value of land and additions on the property. | Land | Improvement |
|---|---|---|---|---|
| 2024 | $1,843 | $27,855 | $2,959 | $24,896 |
| 2023 | $1,843 | $27,855 | $2,959 | $24,896 |
| 2022 | $1,360 | $21,063 | $3,128 | $17,935 |
| 2021 | $1,373 | $21,670 | $3,218 | $18,452 |
| 2020 | $1,232 | $19,162 | $2,860 | $16,302 |
| 2019 | $1,219 | $19,162 | $2,860 | $16,302 |
| 2018 | $987 | $14,968 | $2,016 | $12,952 |
| 2017 | $959 | $14,968 | $2,016 | $12,952 |
| 2016 | $1,028 | $17,569 | $2,229 | $15,340 |
| 2014 | -- | $18,322 | $2,428 | $15,894 |
Source: Public Records
Map
Nearby Homes
Your Personal Tour Guide
Ask me questions while you tour the home.