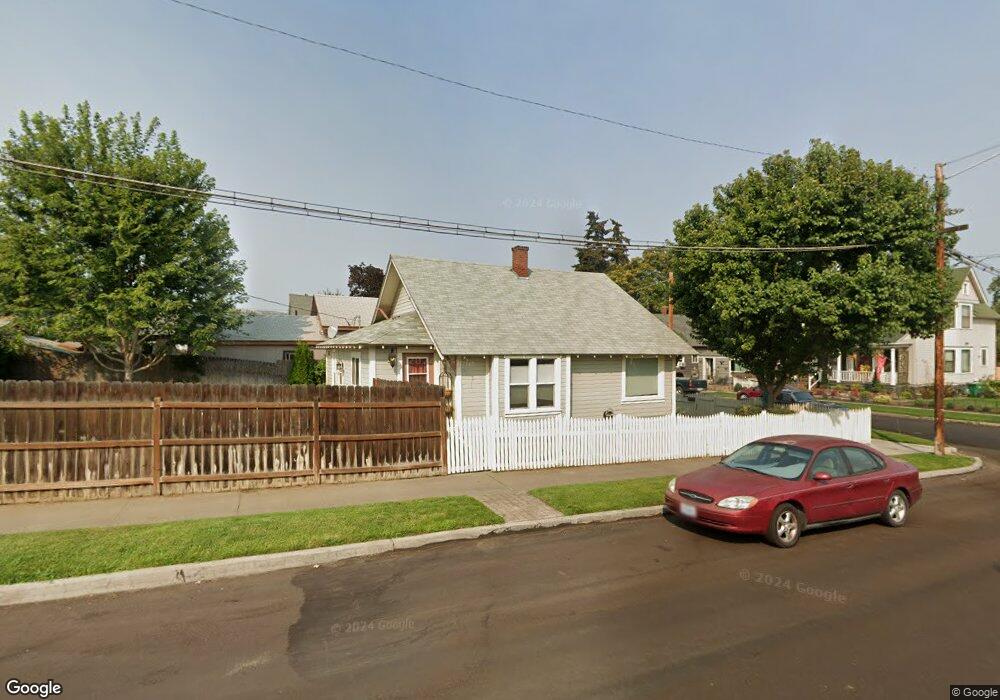
922 E 8th St the Dalles, OR 97058
Estimated Value: $309,540 - $360,000
3
Beds
2
Baths
914
Sq Ft
$366/Sq Ft
Est. Value
About This Home
This home is located at 922 E 8th St, the Dalles, OR 97058 and is currently estimated at $334,770, approximately $366 per square foot. 922 E 8th St is a home located in Wasco County with nearby schools including Dry Hollow Elementary School, The Dalles Middle School, and The Dalles High School.
Ownership History
Date
Name
Owned For
Owner Type
Purchase Details
Closed on
Jun 11, 2013
Sold by
Johnson Randy D and Johnson Randall David
Bought by
Johnson Randy D and Johnson Randall David
Current Estimated Value
Home Financials for this Owner
Home Financials are based on the most recent Mortgage that was taken out on this home.
Original Mortgage
$117,600
Outstanding Balance
$82,633
Interest Rate
3.37%
Mortgage Type
New Conventional
Estimated Equity
$252,137
Purchase Details
Closed on
Nov 22, 2005
Sold by
Baldwin Florence M
Bought by
Johnson Randy D and Johnson Tracey J
Create a Home Valuation Report for This Property
The Home Valuation Report is an in-depth analysis detailing your home's value as well as a comparison with similar homes in the area
Purchase History
| Date | Buyer | Sale Price | Title Company |
|---|---|---|---|
| Johnson Randy D | -- | Ameri Title | |
| Johnson Randy D | -- | -- |
Source: Public Records
Mortgage History
| Date | Status | Borrower | Loan Amount |
|---|---|---|---|
| Open | Johnson Randy D | $117,600 |
Source: Public Records
Tax History
| Year | Tax Paid | Tax Assessment Tax Assessment Total Assessment is a certain percentage of the fair market value that is determined by local assessors to be the total taxable value of land and additions on the property. | Land | Improvement |
|---|---|---|---|---|
| 2025 | $2,143 | $119,283 | -- | -- |
| 2024 | $2,084 | $115,809 | -- | -- |
| 2023 | $2,024 | $112,436 | $0 | $0 |
| 2022 | $1,979 | $133,036 | $0 | $0 |
| 2021 | $1,918 | $129,161 | $0 | $0 |
| 2020 | $1,871 | $125,399 | $0 | $0 |
| 2019 | $1,975 | $121,747 | $0 | $0 |
| 2018 | $1,921 | $96,988 | $0 | $0 |
| 2017 | $1,860 | $94,163 | $0 | $0 |
| 2016 | $1,820 | $91,420 | $0 | $0 |
| 2015 | $1,584 | $78,583 | $0 | $0 |
| 2014 | $1,539 | $76,294 | $0 | $0 |
Source: Public Records
Map
Nearby Homes
Your Personal Tour Guide
Ask me questions while you tour the home.